For March 2023 , we’ve racked up some 482 chages via our Dealership Analysis Reporting activities. This represents a decrease on the figures for our February Report.
Not content with beaavering away tracking data, we also visited the 2023 Commercial Vehicle Show at the NEC. Well, someone had to give us an excuse to get out!

Analysis of Dealership by Vehicle Type
Breaking down the changes by vehicle type, the 482 break down thus: Car - 224, LCV 95, HGV 32, with Motorcycle and ATV at 131.
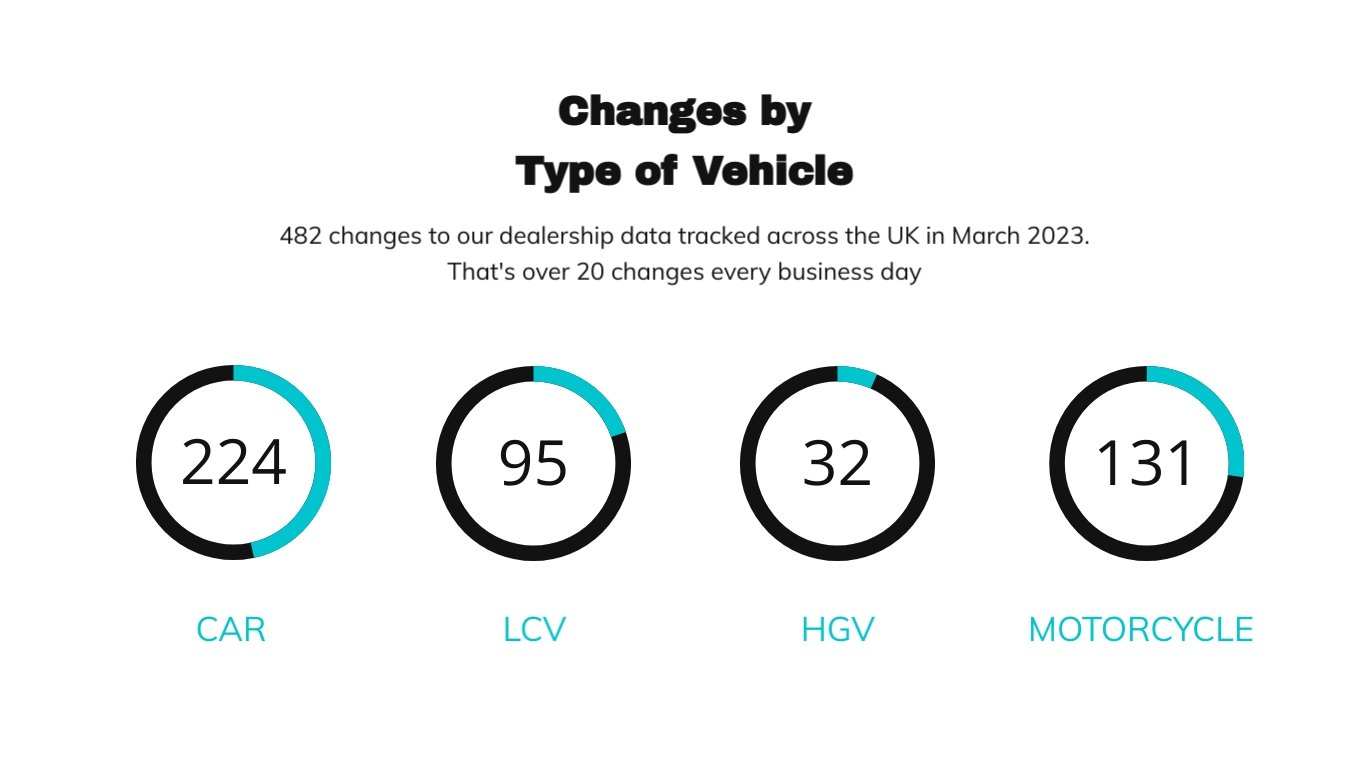
Image: Analysis of Dealerships By Vehicle Type March 2023
Reporting on Changes in Data by Site Type
Making sense of data shouldn’t be all time consuming. In this image we demonstrate clearly how thos 482 changes pan out by site type.

Image: Reporting on Changes in Data by Site Type
A Change In Category By Acivity Type? No Problem
There are many reasons for category changes. In the graphic below, we’ve highlighted a few from the many that we monitor.

Image: Change In Category By Acivity Type
A Visualisation of UK Changes By Location
How do the changes stack up across the country? The next image shows changes a visualisation of UK Dealerships by location.

Image: Visualisation of UK Changes by Location March 2023
We also recently launched a new data change report for dealerships. You could get a subscription here.