Viewing entries in
Data Update

Dealership Network Update April 2025

Dealership Movements by Vehicle Type

Dealership Changes by Vehicle Type – April 2025

Breakdown of franchised dealership openings and closures by vehicle type in April 2025, including cars, commercials and motorcycles.

Cars and commercials remain prominant, but this image clearly highlights modest activity in the motorcycle segment too. There's a noticeable volume of car dealership changes, with more brands making decisions around their car-focused representation than any other type. Overall, movement is slightly less this month than March (445 vs 505). But still, a not too shabby 22 changes per business day.

Geographic Distribution of Changes

UK Dealership Change Map – April 2025

A map highlighting where dealership openings and closures occurred in the UK during April 2025

This month’s distribution shows a concentration of network activity in England’s heartland, especially the Midlands. Pockets appear along the North and South coastal regions, but there’s a wide national coverage in terms of dealership data changes.

Changes in Data by Site Type

Chart showing dealership openings and closures by site type – April 2025

Visual showing how dealership openings and closures were distributed across different franchised site types

The site type breakdown gives insight into which operational formats are gaining ground. Certain dealership formats saw increased activity, particularly among multi-purpose (sales & service franchised outlets.

Franchise Movements – Who's In and Who’s Out?

Chart showing franchises appointed and relinquished by category in April 2025

Chart highlighting the number of new franchise appointments versus relinquishments across dealership categories in April 2025

There’s strong evidence of strategic restructuring, with more franchises being relinquished than newly appointed in certain categories. Other segments show a more balanced shift, suggesting brand realignment rather than expansion.

Ask JS Management

Question:
Which vehicle category saw the most dealership activity in April 2025?

Answer:
Based on April’s figures, car dealerships accounted for the majority of network changes, followed closely by commercial vehicle outlets. Motorcycle networks were active, suggesting varied brand strategies across segments.

Final Thoughts

April’s charts tell a story of targeted shifts rather than sweeping change – with most activity likely driven by regional strategies. Whether you’re planning network expansion, competitive tracking, or supplier targeting, this month’s data shows where the movement is happening – and where opportunity could be next.

Dealership Network Update March 2025

It’s been another eventful month for franchised networks across the UK! March brought a mix of new appointments, reshuffles across regions, and some intriguing trends in vehicle type coverage. Let’s unpack exactly what the data is showing us — one graphic at a time.

Overview of Dealership Network Changes – March 2025

Welcome to March: What’s Happening in the Network?

The month kicked off with a clear sign of movement in the franchised dealership space. Brands adjusted footprints, new outlets emerged, and a steady flow of activity shaped what could become longer-term strategic realignments. We set the tone below, giving us a bird’s-eye view of what March delivered.

Changes by Vehicle Type

This graphic reveals a noticeable contrast across vehicle categories. Some segments — especially those tied to LCV and HGV’s — saw net gains over February, while Motorcycles increased significantly. It’s a clear indicator of where the market attention is currently centred and where dealers are adapting coverage.

Dealership Changes by Vehicle Type – March 2025

Graph showing franchised dealership network changes segmented by vehicle type for March 2025.

Geographic Shifts: Where the Changes Happened

UK Map of Dealership Network Changes – March 2025

Map showing UK regions with dealership openings, closures, or shifts in March 2025.

There’s no doubt about it — some areas were busier than others. This map makes it easy to spot where the action took place, with visible clusters of openings and a few strategic closures. If you’re advising a network or scouting locations, this is the type of map you’ll want to study closely.

Site Type Movement Snapshot

Dealership Network Movement by Site Type – March 2025

Graph depicting franchised dealership openings and closures segmented by site type in March 2025.

This chart breaks down which types of franchised sites were added or removed — whether they were full retail locations, secondary points, or multi-purpose outlets. It gives us insight into how brands are deploying their physical footprint to match demand.

Franchise Appointments and Relinquishments

Franchise Appointments vs Relinquishments – March 2025

Chart showing the volume of new franchise appointments and relinquishments across categories for March 2025.

This is where we really see the change across categories — which brands added new partners and which ones were let go. Each segment can represent a choice made by a brand or dealer group to adjust the network, realign responsibilities, or make way for emerging priorities.


Dealership Network Update February 2025

February brought more frostbitten surprises and more familiar reshuffling across the UK’s franchised dealership landscape. There’s a steady rhythm to this month’s changes — brands adjusting positions and formats while volume shifts show an increase.

Let’s unpack what the data tells us.

Overview infographic summarising total dealership movements and category changes in February 2025

There’s been an uptick this month 471 vs 349, suggesting brands are making multiple changes across the networks. Excluding Dealerships, activity is spread throughout multiple categories - with no standout surge in one direction.

Dealership Changes by Vehicle Type

Chart showing net dealership changes by vehicle type in February 2025

Visual breakdown of dealership increases and decreases by car, van, and other vehicle categories in February 2025

With the exceptopn of Motorcycles, Car and van categories remain the main players this month, with modest shifts across both. The changes represent an increase across all 4 in comparison to January 2025.

Regional Dealership Activity

Map showing dealership changes by UK region in February 2025

Visual map indicating dealership changes by UK region for February 2025

Geographically, there’s a fairly even spread of changes this month, but slight fluctuations are visible across central and southern England. The activity appears distributed rather than concentrated — a continuation of measured adjustments from January.

Dealerships by Site Type

Infographic showing dealership changes by site type in February 2025

Graphic showing dealership movement across showroom, aftersales, and combined site types for February 2025

Full-service/Dealerships (sales + aftersales) sites remain the dominant format, with fewer single-category openings. The balance of aftersales vs ‘other’ sites is relatively even. Sales only (showrooms) & Used car sites make up the difference.

Franchise Appointments and Relinquishments + More

Chart comparing appointed and relinquished franchises by category in February 2025

Visual comparison of dealership franchise appointments and exits by business category for February 2025


Dealership Network Update January 2025 - Trends & Changes

As you’d expect, January begins with an increase in changes by type of vehicle across the Dealership networks. There are 349 changes vs 274 in December giving us over 15 changes per business day.

A notable highlight this month? Commercial vehicle dealerships saw the biggest net gains, as LCV and truck volumes climbed. Passenger car networks showed an increase too, as always making up the bulk of movements.

Regional Spotlight: Where the Action Happened

A graphic representation of where the changes happened is detailed above. If you hop over to autosites.co.uk, you can see the most up to date version of events as this is driven off our live system.

Next in line, the infographic illustrates the changes occuring by site type. This site type analysis represents a small example of the key categories covered by our activities.

When it comes to the ‘type of change’ across the networks, we’ve not sat idle. This data represents all of the updates occuring within the different types of site. January 2024 is weighted toward Franchises appointed vs those relinquished.

January set a confident tone for the year – with movement across regions, vehicle types, and site formats. Whether these dealership trends hold or evolve will depend on manufacturer strategy and consumer sentiment through Q2. As always, JS Management will continue to bring you monthly updates so you can plan and adapt with clarity.


https://www.jsmanagement.com/contact-us

Dealership Network Update December 2024

As we come to the end of 2024, the usual slowdown has taken its toll. We’ve recorded 270 changes throughout December 2024, that’s still over 13 changes every business day though.

Breaking down December’s changes by vehicle type, gives us 178 for Cars, 19 for LCV’s, and 73 for Motorcycles.

Noting the changes is made easy by our Autosites system, you can toggle the pins for site type changes on and off very easily in the menu. In the graphic below, we’ve shown all changes for the month.

Next up, our infographic illustrates data changes by site type. There are numerous categories tracked within our system, here we’ve just shown a sample of the key ones.

December 2024 UK Changes in data by Site Type.

The ‘type’ of change category pulls together all of the updates within the different types of site. For this month, the bulk has been made up of new appointments, terminated franchised agreements and acquisitions.

December 2024 UK Changes in Data by Type of Change

Dealership Network Analysis November 2024

In our November 2024 update, we’ve recorded a ‘not too shabby’ 438 changes within the UK dealership networks. That equates to over 20 changes each business day.

We rank and file these updates across all vehicle catagories. For November, we have Car at 309, LCV at 37, HGV at 9 and Motorcycle at 65.

November 2024 UK Changes by Type of Vehicle

Our map tells you all you need to know about, where in the UK Novembers changes occurred.

With the data by Site Type, we can show how our 420 changes were apportioned amongs the different type of site. This month, aftersales were on par with dealerships.

Changes in Data by Type of Change breaks down the different categories we track (sample is shown below in the graphic).


Dealership Network Analysis October 2024

Dealership Network Analysis October 2024

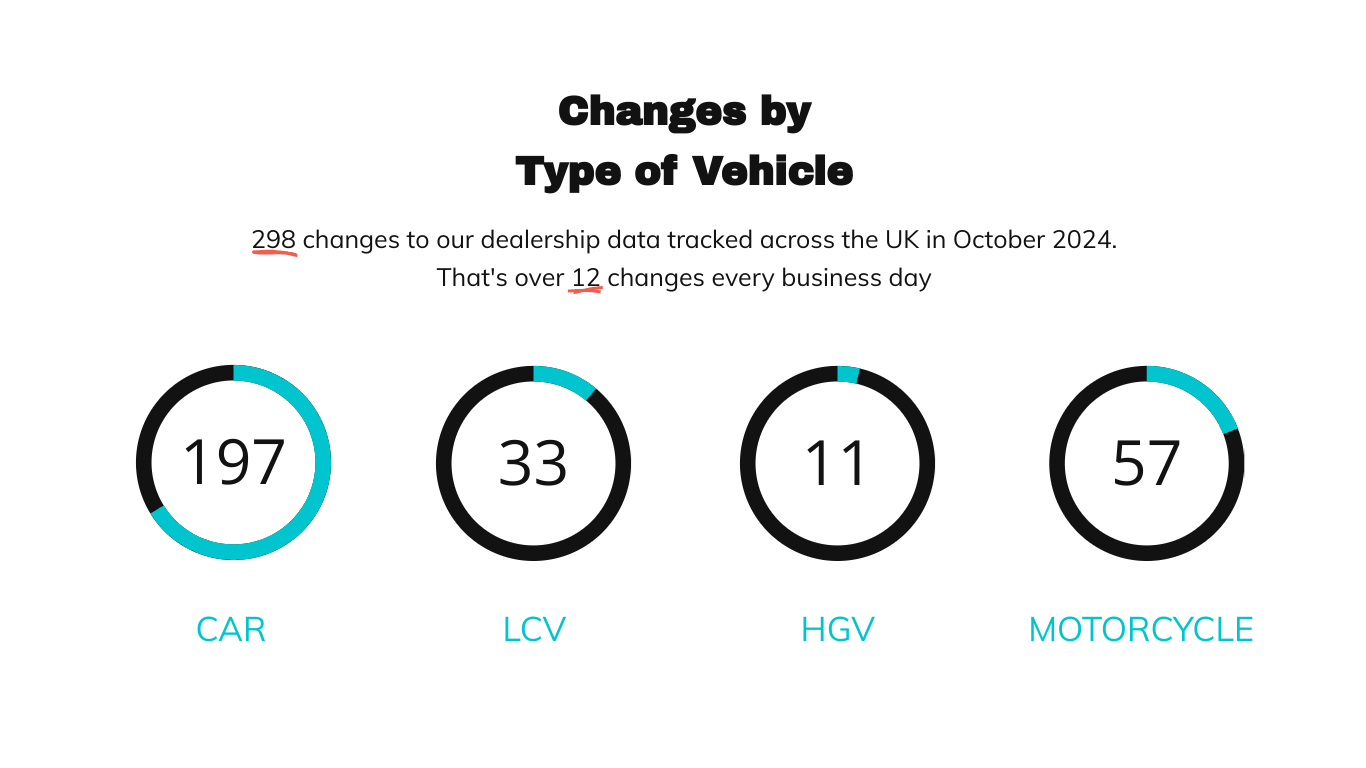
Octobers figures amount to a total of 298 changes throughout the franchised dealer networks. Our tracking has reported over 12 changes every business day.

We cover all types of vehicle in our analysis. For October we’ve broken the changes down by Car (197, LCV (33), HGV (11) and Motorcycle (57).

Network Changes By Geographical Location

In the graphic above, we given some context by highlighting where Octobers movements occured by location.

Dealership Changes in data by Site Type

We also track the changes by site type. Out of the 298 changes for October, dealership changes outweigh the other categories with aftersales coming in second.

Breaking the categories down by the type of change, gives us insight into the reason for change. We track many categories, those illustrated above are a sample.


Dealership Network Update June 2024

Intro Dealership Network Report Update June

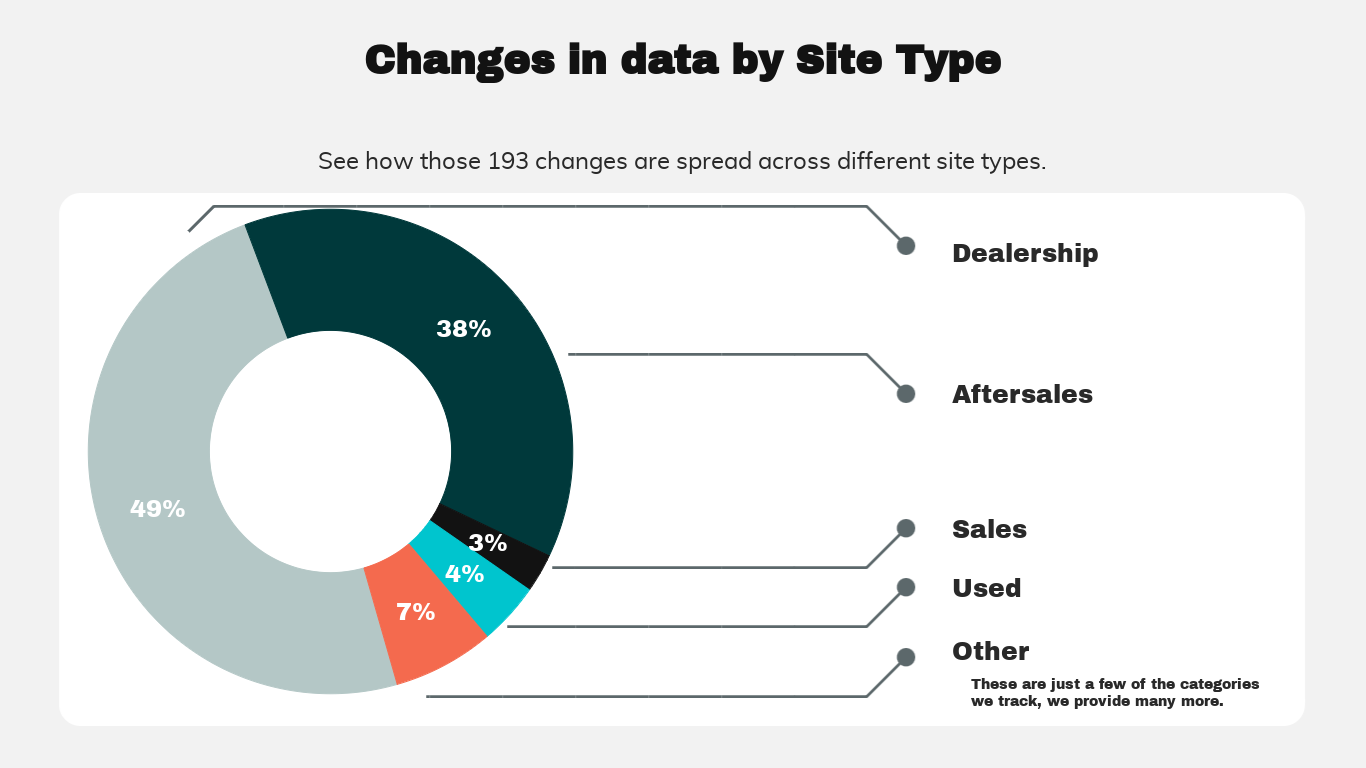
June 2024’s update totals 193 changes across the UK Vehicle dealership networks. We’ve broken the movements down by vehicle type in the graphic below:

Image Changes By Type Of Vehicle June 2024

The geographical changes by location for June 2024 are illustrated in the map view:

Image June 2024 Report By Dealership Location Map View UK

The pie chart demonstrates how the changes occurred across the different site types for the month:

Image June 2024 Data Report By Site Type

We track changes over multiple categories, we’ve included a few to demonstrate how these can be broken down:

Image June 2024 Network Report By Franchise Category

DEALERSHIP TREND REPORT MAY 2024

Image May Dealership Network Report Header 2024

Let’s face it, a Dealership trend report is a useful ally if you are involved in network planning activities. Spotting opportunities without the right data can, however lead to lost opportunities and inefficiencies. Enter our Dealership report for May 2024. Used with previous months data, it can help spot trends and give insight that others may have missed. This month for example, we’ve racked up 273 changes (vs 394 in April). Have we been lazy? No. It’s just been a little quieter than previously.

Image May 2024 Report Dealership by Type of Vehicle

The updates to Dealership by type of vehicle have declined over the past month. April’s figures are shown in brackets: Car 128 (198), HGV 2, (10), LCV 62 (94) and Motorcycle/ATV 81 (93).

Image May 2024 Report By Dealership Location Map View UK

The map shows the geographical changes by location.

Image May 2024 Data Report By Site Type

Our report on data updates by site type shows Dealerships making up most of the changes for this month at 58%, a miniscule decrease from the previous month (57%). Aftersales is represented at 26% (vs 23%), used at 7% (9%) and the ‘other’ category down at 6% (10%).

Image May 2024 Network Report By Franchise Categor

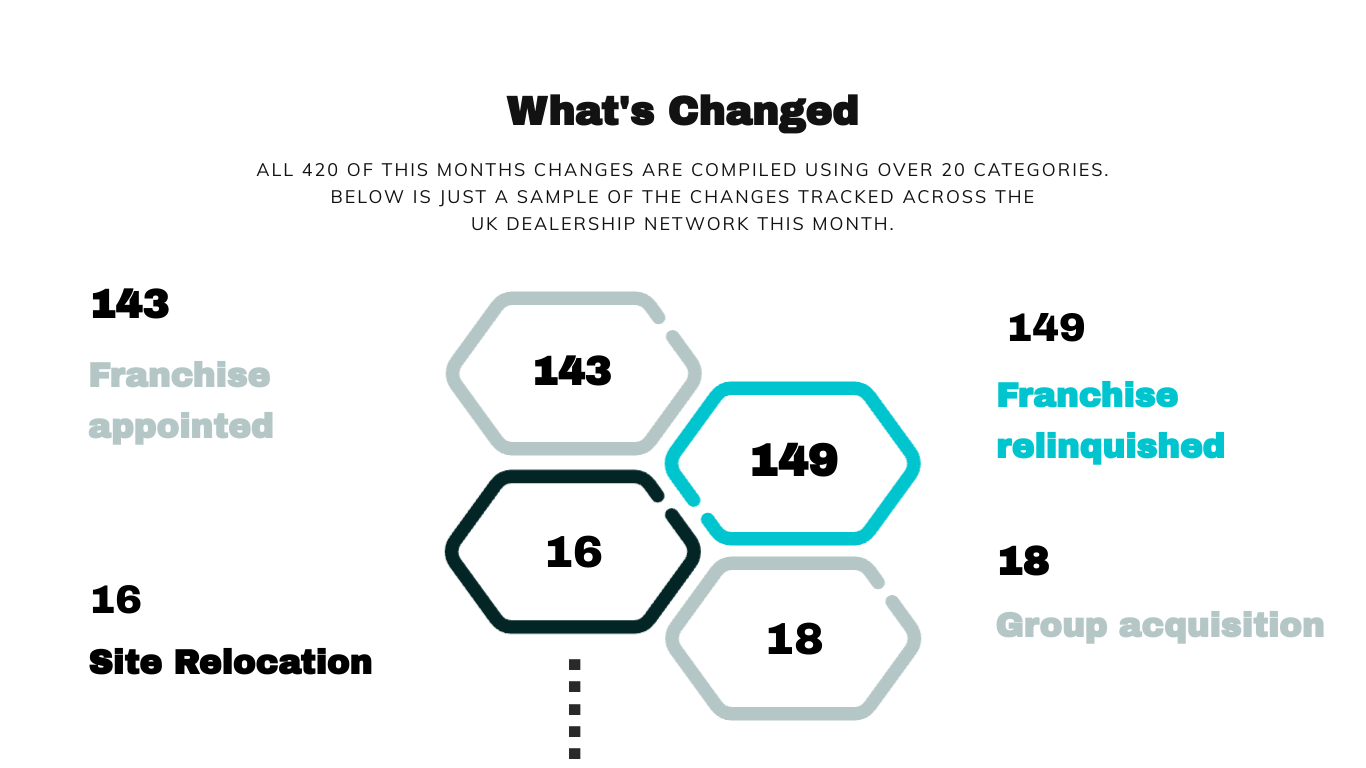
Never suffering from a lack of categories in our dataset, we monitor and report on a multitude. For May 2024, we’ve recorded the following: 105 franchises appointed (vs April at 91), 80 franchises relinquished (vs April at 96), 3 dealership relocations (vs 17 in April) and 9 name changes (vs 42 in April).

Dealership Trend Report (Locations) March 2024

Image March Dealership Network Report Header 2024

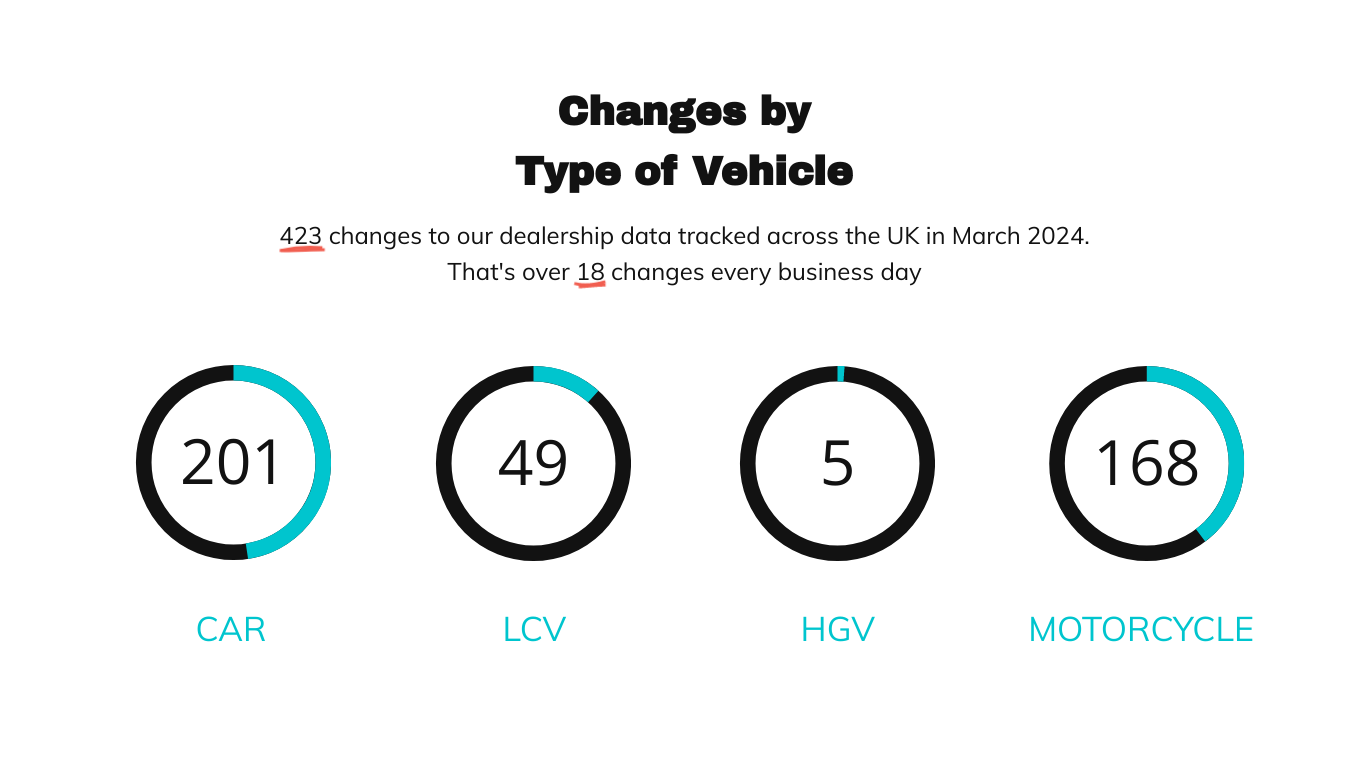
JS Management makes it easy to track Dealership locations with our data. Here we’re reporting movements UK wide, across many different categories and vehicle types. If you have the time, you can easily compile Dealership trend reports by looking at our previous updates. In this post we are representing changes through March 2024.

Dealership changes by type of vehicle have increased overall from 388 to 423 since February (breakdown figures are shown in brackets). Car 201 (262), HGV 5, (16), LCV 49 (41) and Motorcycle/ATV 168 (69).

Image March 2024 Report By Dealership Location Map View UK

The UK map clearly reports where the changes have occured through March 2024

This months changes in data by site type report Dealerships taking up a fair chunk of the movements for the month at 64%, an increase from the previous month (52%). Aftersales is represented at 23% (vs 29%), used at 6% (5%) and the ‘other’ category down to 5% vs 10% in February.

Image March 2024 Network Report By Franchise Category

As we wind down our report for March, we’ll end with changes by franchise category. There are 96 changes by franchise appointed (vs 81 in December), 138 franchises relinquished (vs 85) and 25 site relocations (vs 16) in the previous month). Group Acquisitions, have reduced somewhat this monh, totalling 10 (vs 54 previously).

DEALERSHIP NETWORK UPDATE FEBRUARY 2024

Image February Dealership Network Update Header 2024

Our update for February 2024 gives an insight into the increases across the network since January. This month we have seen an increase of 81 in total. This represents 18 changes per business day.

Image February 2024 Updates to Dealership by Type of Vehicle

Dealerships by type of vehicle have increased since January (figures are shown in brackets). Car 262 (186), HGV 16, (11), LCV 41 (34) and Motorcycle/ATV 69 (76).

Image February 2024 Updates By Dealership Location Map View UK

February’s account of where the movements occured physically is shown in the map image.

Image February 2024 Data Update By Site Type

Changes by site type shows Dealerships taking up the majority of the movements for this month at 52%, a slight decrease from the previous month (49%). Aftersales is represented at 29% (vs 34%), used at 5% (8%) and the ‘other’ category 10% vs 7% in January.

Image February 2024 Network Update By Franchise Category

Finalising Februay’s figures we’re showing changes by franchise category. We’ve totalled 81 changes by franchise appointed (vs 49 in December), 85 franchises relinquished (vs 102) and 16 site relocations (vs 20) in the previous month). Significantly up though are Group Acquisitions, coming in at 54 (vs 12 previously).

Dealership Network Update January 2024

Image January Dealership Network Update Header 2024

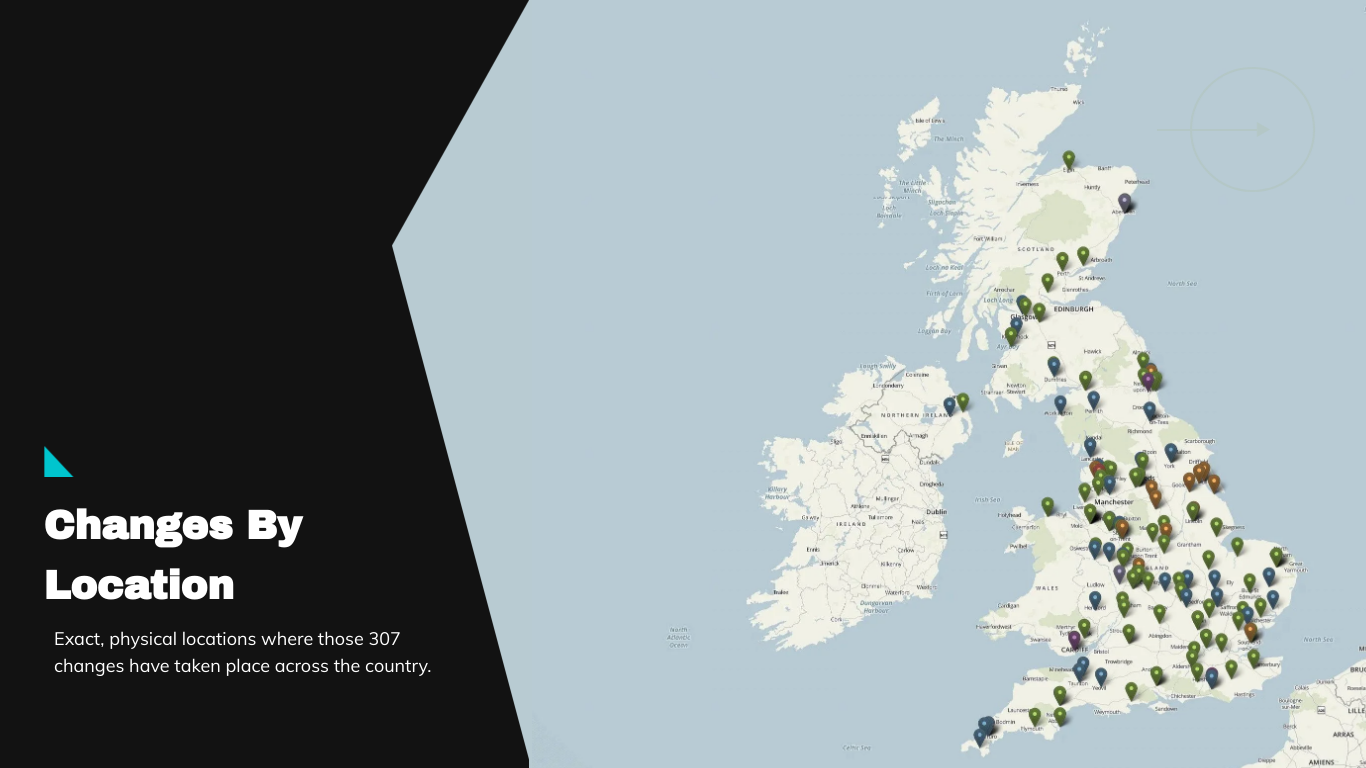
January 2024’s numbers are steadily rising over the previous month. Across the dealership networks, we’ve recorded 307 changes (vs 227 previously) for this month alone. This represents 13 changes per business day.

Image January 2024 Updates to Dealership by Type of Vehicle

Changes to Dealership by type of vehicle has increased since December, with the exception of the LCV category, which has shown a decrease of 23 changes. Decembers figures are shown in brackets: Car 186 (139), HGV 11, (3) and Motorcycle/ATV 76 (28).

Image January 2024 Updates By Dealership Location Map View UK

We’ve mapped out the Dealership changes for January on the UK map graphic above.

Image January 2024 Data Update By Site Type

The data update by site type shows Dealerships taking up the bulk of the changes for this month at 49%, a slight decrease from the previous month (52%). Aftersales is represented at 34% (vs 30%), used at 8% (9%) and the ‘other’ category the same at 7%.

Image-January-2024-Network-Update-By-Franchise-Category

We conclude Januarys figures with an update to the changes by franchise category. We’ve totalled 49 changes by franchise appointed (vs 69 in December), 102 franchises relinquished (vs 52) and 20 site relocations (vs 7 in the previous month).