Dealership Network Update April 2025

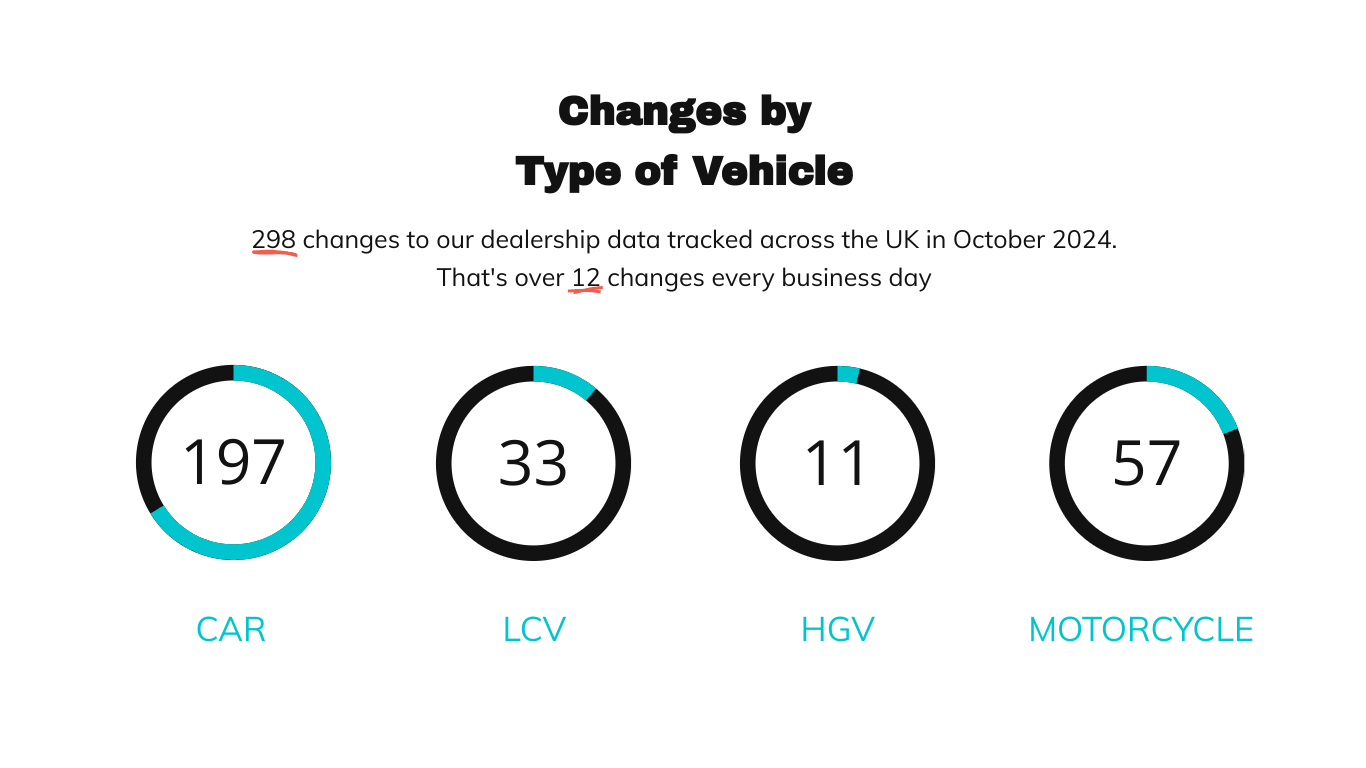
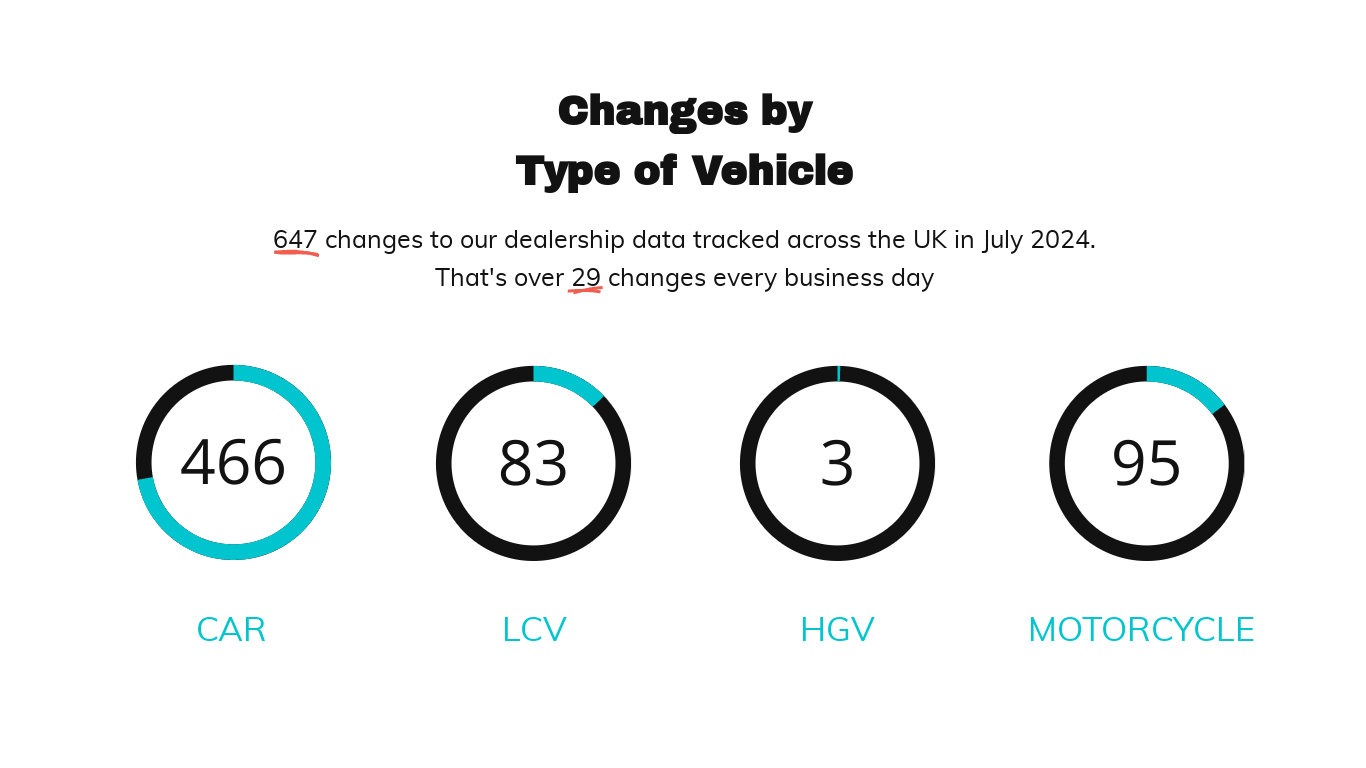
Dealership Movements by Vehicle Type

Dealership Changes by Vehicle Type – April 2025

Breakdown of franchised dealership openings and closures by vehicle type in April 2025, including cars, commercials and motorcycles.

Cars and commercials remain prominant, but this image clearly highlights modest activity in the motorcycle segment too. There's a noticeable volume of car dealership changes, with more brands making decisions around their car-focused representation than any other type. Overall, movement is slightly less this month than March (445 vs 505). But still, a not too shabby 22 changes per business day.

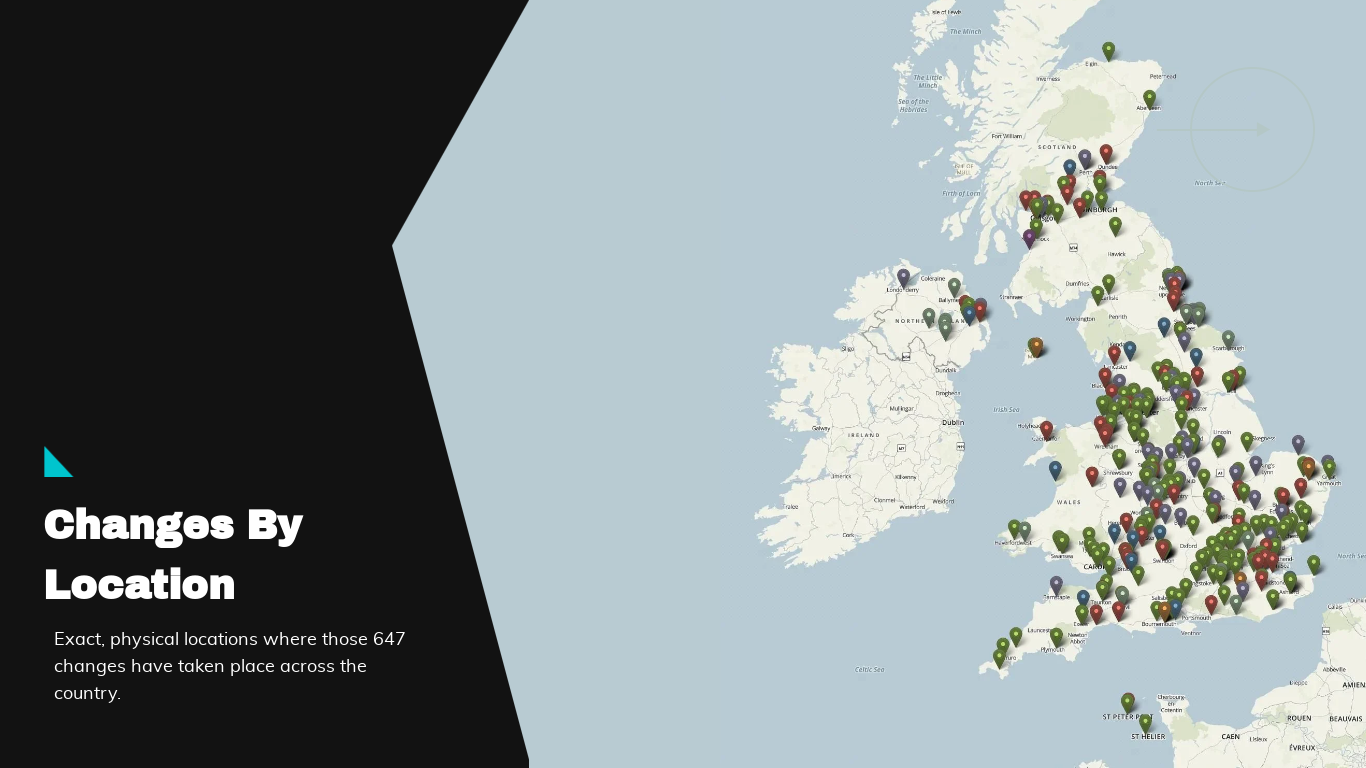
Geographic Distribution of Changes

UK Dealership Change Map – April 2025

A map highlighting where dealership openings and closures occurred in the UK during April 2025

This month’s distribution shows a concentration of network activity in England’s heartland, especially the Midlands. Pockets appear along the North and South coastal regions, but there’s a wide national coverage in terms of dealership data changes.

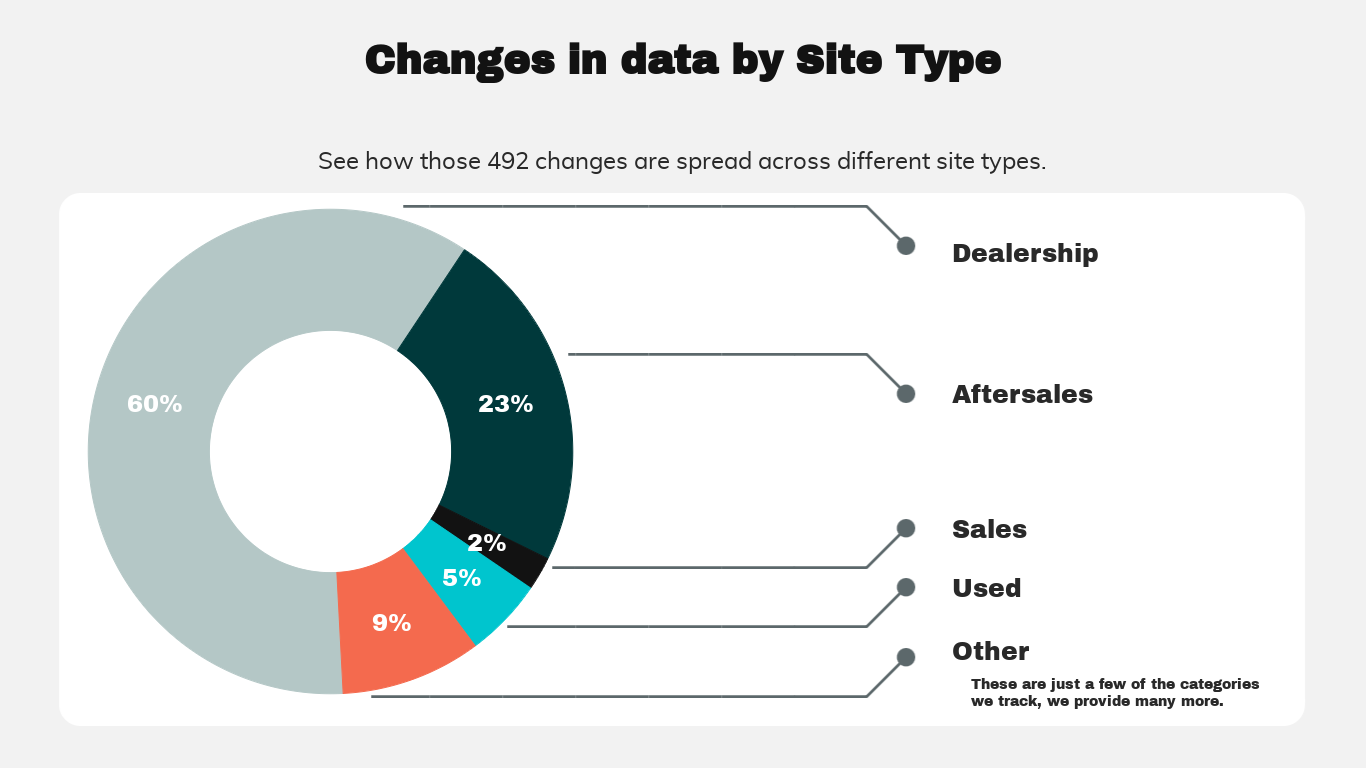
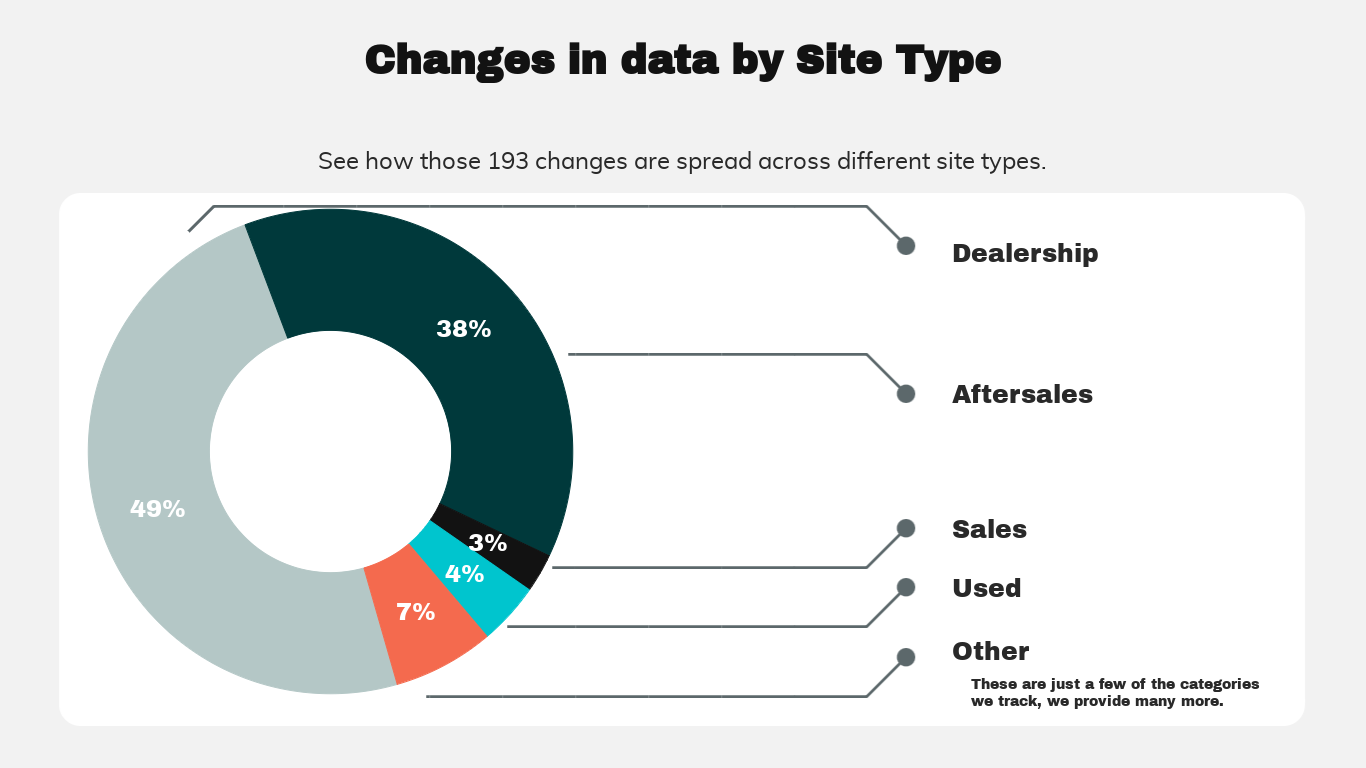
Changes in Data by Site Type

Chart showing dealership openings and closures by site type – April 2025

Visual showing how dealership openings and closures were distributed across different franchised site types

The site type breakdown gives insight into which operational formats are gaining ground. Certain dealership formats saw increased activity, particularly among multi-purpose (sales & service franchised outlets.

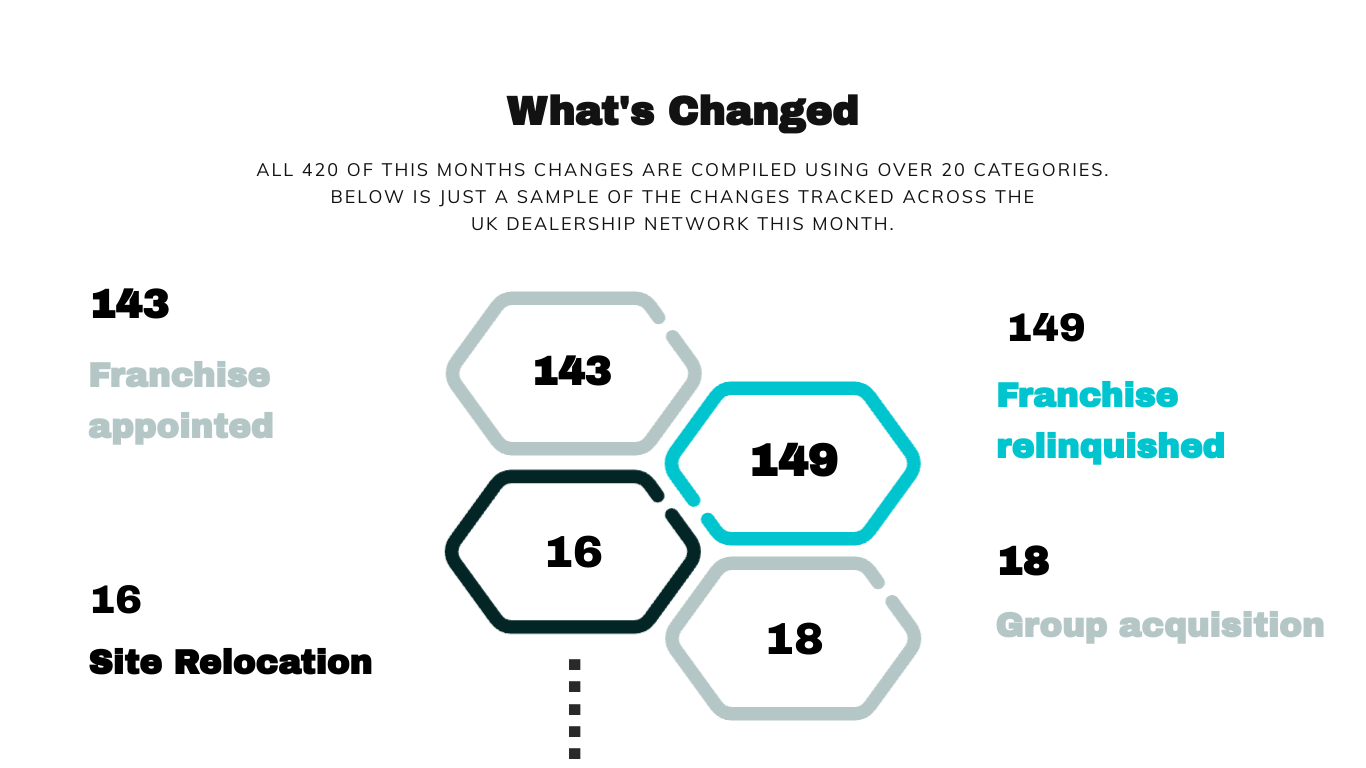
Franchise Movements – Who's In and Who’s Out?

Chart showing franchises appointed and relinquished by category in April 2025

Chart highlighting the number of new franchise appointments versus relinquishments across dealership categories in April 2025

There’s strong evidence of strategic restructuring, with more franchises being relinquished than newly appointed in certain categories. Other segments show a more balanced shift, suggesting brand realignment rather than expansion.

Ask JS Management

Question:
Which vehicle category saw the most dealership activity in April 2025?

Answer:
Based on April’s figures, car dealerships accounted for the majority of network changes, followed closely by commercial vehicle outlets. Motorcycle networks were active, suggesting varied brand strategies across segments.

Final Thoughts

April’s charts tell a story of targeted shifts rather than sweeping change – with most activity likely driven by regional strategies. Whether you’re planning network expansion, competitive tracking, or supplier targeting, this month’s data shows where the movement is happening – and where opportunity could be next.

How Many Car Repair Garages Are There in the UK? And What Percentage Also Sell Used Cars?

A question we often get at JS Management is: How many car repairers aka “garages” are there in a specific area of the UK? The short answer is, it depends on what kind of garage you're looking for. To demonstrate the power of our data platform, Autosites, we used a sample area in the South West, roughly stretching from Bude to Lapford, sweeping down to Kingsbridge and across to Penzance.

For this exercise, we’ve excluded Franchised Dealerships.

Mapping the Independent Garage Landscape

We fanatically track over 30,000 independent garages in the UK. In this sample zone, it is easy to see the dominance of these repairers—local businesses offering service, maintenance, and repair (SMR) options. These vastly outnumber the more recognisable fast fit chains and national autocentre brands.

How Many Car Repair Garages in UK South West

Our animation clearly shows the footprint of independent SMR garages. In this case, vs fast fit networks in our South West region sample.

While the fast fit chains are highly visible, they account for a much smaller share of the total market here. Our mapping reveals that independents make up over 90% of the car repair locations in the region we surveyed. It’s a powerful illustration of how deeply embedded these local businesses are in the South West’s automotive ecosystem.

These fast fit centres include well-known networks such as:

  • Kwik Fit

  • Halfords Autocentre

  • Protyre

  • HIQ

  • First Stop

  • NTA

  • Others

With Autosites, we don’t just count garages - we break down which brands dominate specific areas, right down to their individual site locations. This data is essential for identifying brand penetration.

What Percentage of Independent Garages Also Sell Used Cars?

Another lesser-known detail - not all garages are purely focused entirely on repairs. We’ve listed a small portion who operate as used car dealers, combining sales and servicing under one roof.

In our South West sample area, only around 4% of independent SMR garages also sell used cars. This small crossover shows just how specialised the automotive retail and repair markets have become - even within seemingly local businesses.

In contrast, there are dedicated used car sites (sometimes operating from forecourts or “used car sales pitches”) that don’t offer servicing at all. Many of these are sales-only garages with no mechanical repair facilities.

Image of Percentage of Garages Who Also Sell Used Cars

The implication? If you're looking for a repair garage that also sells used cars, it’s far less common than you might think. In this example, these hybrid operations are relatively rare.

Why This Matters

The South West’s vehicle economy is nuanced, and generalised national data won’t tell you:

  • Which areas have the densest repair network

  • Which towns are dominated by independents vs chains

  • Where to find used car operations with or without a servicing arm

That's why we built Autosites - a tool to uncover deep market intelligence from street-level automotive business mapping. Whether you're a parts supplier, franchised dealer group, service provider, or simply researching the market, we can give you tailored insights based on precise geographies, not just broad national stats.

If you'd like access to the full data breakdown, or want to map a different region please get in touch.

Supplementary Area Insight

To help provide context, the South West has one of the UK’s highest car ownership rates per capita. According to Nimblefins, South West England consistently shows higher-than-average car ownership, a key factor in the volume of repair businesses in the area.

Combined with a rural road network and limited public transport in many of these towns, it's easy to see why local garage coverage remains high.

Interested in Independent garage market intelligence? We’re just getting started.

Dealership Network Update March 2025

It’s been another eventful month for franchised networks across the UK! March brought a mix of new appointments, reshuffles across regions, and some intriguing trends in vehicle type coverage. Let’s unpack exactly what the data is showing us — one graphic at a time.

Overview of Dealership Network Changes – March 2025

Welcome to March: What’s Happening in the Network?

The month kicked off with a clear sign of movement in the franchised dealership space. Brands adjusted footprints, new outlets emerged, and a steady flow of activity shaped what could become longer-term strategic realignments. We set the tone below, giving us a bird’s-eye view of what March delivered.

Changes by Vehicle Type

This graphic reveals a noticeable contrast across vehicle categories. Some segments — especially those tied to LCV and HGV’s — saw net gains over February, while Motorcycles increased significantly. It’s a clear indicator of where the market attention is currently centred and where dealers are adapting coverage.

Dealership Changes by Vehicle Type – March 2025

Graph showing franchised dealership network changes segmented by vehicle type for March 2025.

Geographic Shifts: Where the Changes Happened

UK Map of Dealership Network Changes – March 2025

Map showing UK regions with dealership openings, closures, or shifts in March 2025.

There’s no doubt about it — some areas were busier than others. This map makes it easy to spot where the action took place, with visible clusters of openings and a few strategic closures. If you’re advising a network or scouting locations, this is the type of map you’ll want to study closely.

Site Type Movement Snapshot

Dealership Network Movement by Site Type – March 2025

Graph depicting franchised dealership openings and closures segmented by site type in March 2025.

This chart breaks down which types of franchised sites were added or removed — whether they were full retail locations, secondary points, or multi-purpose outlets. It gives us insight into how brands are deploying their physical footprint to match demand.

Franchise Appointments and Relinquishments

Franchise Appointments vs Relinquishments – March 2025

Chart showing the volume of new franchise appointments and relinquishments across categories for March 2025.

This is where we really see the change across categories — which brands added new partners and which ones were let go. Each segment can represent a choice made by a brand or dealer group to adjust the network, realign responsibilities, or make way for emerging priorities.


Dealership Network Update February 2025

February brought more frostbitten surprises and more familiar reshuffling across the UK’s franchised dealership landscape. There’s a steady rhythm to this month’s changes — brands adjusting positions and formats while volume shifts show an increase.

Let’s unpack what the data tells us.

Overview infographic summarising total dealership movements and category changes in February 2025

There’s been an uptick this month 471 vs 349, suggesting brands are making multiple changes across the networks. Excluding Dealerships, activity is spread throughout multiple categories - with no standout surge in one direction.

Dealership Changes by Vehicle Type

Chart showing net dealership changes by vehicle type in February 2025

Visual breakdown of dealership increases and decreases by car, van, and other vehicle categories in February 2025

With the exceptopn of Motorcycles, Car and van categories remain the main players this month, with modest shifts across both. The changes represent an increase across all 4 in comparison to January 2025.

Regional Dealership Activity

Map showing dealership changes by UK region in February 2025

Visual map indicating dealership changes by UK region for February 2025

Geographically, there’s a fairly even spread of changes this month, but slight fluctuations are visible across central and southern England. The activity appears distributed rather than concentrated — a continuation of measured adjustments from January.

Dealerships by Site Type

Infographic showing dealership changes by site type in February 2025

Graphic showing dealership movement across showroom, aftersales, and combined site types for February 2025

Full-service/Dealerships (sales + aftersales) sites remain the dominant format, with fewer single-category openings. The balance of aftersales vs ‘other’ sites is relatively even. Sales only (showrooms) & Used car sites make up the difference.

Franchise Appointments and Relinquishments + More

Chart comparing appointed and relinquished franchises by category in February 2025

Visual comparison of dealership franchise appointments and exits by business category for February 2025


Dealership Network Update January 2025 - Trends & Changes

As you’d expect, January begins with an increase in changes by type of vehicle across the Dealership networks. There are 349 changes vs 274 in December giving us over 15 changes per business day.

A notable highlight this month? Commercial vehicle dealerships saw the biggest net gains, as LCV and truck volumes climbed. Passenger car networks showed an increase too, as always making up the bulk of movements.

Regional Spotlight: Where the Action Happened

A graphic representation of where the changes happened is detailed above. If you hop over to autosites.co.uk, you can see the most up to date version of events as this is driven off our live system.

Next in line, the infographic illustrates the changes occuring by site type. This site type analysis represents a small example of the key categories covered by our activities.

When it comes to the ‘type of change’ across the networks, we’ve not sat idle. This data represents all of the updates occuring within the different types of site. January 2024 is weighted toward Franchises appointed vs those relinquished.

January set a confident tone for the year – with movement across regions, vehicle types, and site formats. Whether these dealership trends hold or evolve will depend on manufacturer strategy and consumer sentiment through Q2. As always, JS Management will continue to bring you monthly updates so you can plan and adapt with clarity.


https://www.jsmanagement.com/contact-us

Dealership Network Update December 2024

As we come to the end of 2024, the usual slowdown has taken its toll. We’ve recorded 270 changes throughout December 2024, that’s still over 13 changes every business day though.

Breaking down December’s changes by vehicle type, gives us 178 for Cars, 19 for LCV’s, and 73 for Motorcycles.

Noting the changes is made easy by our Autosites system, you can toggle the pins for site type changes on and off very easily in the menu. In the graphic below, we’ve shown all changes for the month.

Next up, our infographic illustrates data changes by site type. There are numerous categories tracked within our system, here we’ve just shown a sample of the key ones.

December 2024 UK Changes in data by Site Type.

The ‘type’ of change category pulls together all of the updates within the different types of site. For this month, the bulk has been made up of new appointments, terminated franchised agreements and acquisitions.

December 2024 UK Changes in Data by Type of Change

Dealership Network Analysis November 2024

In our November 2024 update, we’ve recorded a ‘not too shabby’ 438 changes within the UK dealership networks. That equates to over 20 changes each business day.

We rank and file these updates across all vehicle catagories. For November, we have Car at 309, LCV at 37, HGV at 9 and Motorcycle at 65.

November 2024 UK Changes by Type of Vehicle

Our map tells you all you need to know about, where in the UK Novembers changes occurred.

With the data by Site Type, we can show how our 420 changes were apportioned amongs the different type of site. This month, aftersales were on par with dealerships.

Changes in Data by Type of Change breaks down the different categories we track (sample is shown below in the graphic).


Dealership Network Analysis October 2024

Dealership Network Analysis October 2024

Octobers figures amount to a total of 298 changes throughout the franchised dealer networks. Our tracking has reported over 12 changes every business day.

We cover all types of vehicle in our analysis. For October we’ve broken the changes down by Car (197, LCV (33), HGV (11) and Motorcycle (57).

Network Changes By Geographical Location

In the graphic above, we given some context by highlighting where Octobers movements occured by location.

Dealership Changes in data by Site Type

We also track the changes by site type. Out of the 298 changes for October, dealership changes outweigh the other categories with aftersales coming in second.

Breaking the categories down by the type of change, gives us insight into the reason for change. We track many categories, those illustrated above are a sample.


Dealership Network Analysis September 2024

Image Dealership Network Analysis September 2024

September 2024 has brought us a noteworthy total of 351 changes, from within the UK Franchised dealer networks. Averaging that out, this equates to approximately 16 changes occurring every business day throughout the month.

Image Changes By Type Of Vehicle September 2024

Not wishing to limit our abilities by restricting dealership data to numbers only, we’ve shown precisely where these franchised garage changes occurred geographically within the UK:

Image September 2024 Analysis By Dealership Location Map View UK

Our monthly graphic, demonstrates how the changes were represented by dealership (sales and service) types, aftersales sites, used car sites and others.

Image September 2024 Data Analysis By Site Type

Franchises appointed, franchises relinquished, site relocations, and sites that have been acquired by other dealer groups are just some of the categories we use. Changes in franchise types are shown specifically for September in the analysis by franchise category data.

Image September 2024 Analysis By Franchise Category

Dealership Network Analysis August 2024

Image Dealership Network Analysis August 2024

This months network analysis shows a little slower progress from the previous month, with dealership changes slowing overall from 647 to 492 overall. However, we’ve still managed to rack up 23 changes per day for Car, LCV, HGV and Motorcycle and ATV.

Image Changes By Type Of Vehicle August 2024

Analysing the dealership data from August displayed on a geographical map, we can easily identify and observe exactly where significant changes have occurred by region. This visual representation allows for a clearer understanding of trends and patterns across different areas.

Image August 2024 Analysis By Dealership Location Map View UK

Looking at the pie chart for this month, we can see how the data was spread across the different site types. We have analyised dealerships, aftersales sites, used car sites and more.

Image August 2024 Data Report By Site Type

The months analysis of what’s changed could be shown in over 20 categories. For the purpose of simplicity, we’ve sampled: Franchised Appointed, Franchise Relinquished, Site Relocation and sites that have been taken over by way of a group acquistion.

Image August 2024 Network Analysis By Franchise Category

Dealership Network Update July 2024

Image Dealership Network Report Update July 2024

July 2024 turned out to be a busy month for movements within the UK franchised dealer networks. For vehicle types we’ve recorded over 29 changes per business day across Car, LCV, HGV, and Motorcycle/ATV.

Image Changes By Type Of Vehicle July 2024

Let’s say that we want to clearly present July’s change in franchises, along with various site types, on a detailed map of the UK. This visual representation helps in understanding how franchises and site type movements are distributed across different regions.

Image July 2024 Report By Dealership Location Map View UK

This month’s pie chart illustrates the various site types that are included in the data set. It effectively gives an idea of the different categories of site and their respective proportions within the overall picture.

Image July 2024 Data Report By Site Type

Our comprehensive tracking system covers a wide variety of site types, which includes not only the various kinds of locations but also aspects such as acquisition, site relocation, and changes in site names.

Image July 2024 Network Report By Franchise Category

Dealership Network Update June 2024

Intro Dealership Network Report Update June

June 2024’s update totals 193 changes across the UK Vehicle dealership networks. We’ve broken the movements down by vehicle type in the graphic below:

Image Changes By Type Of Vehicle June 2024

The geographical changes by location for June 2024 are illustrated in the map view:

Image June 2024 Report By Dealership Location Map View UK

The pie chart demonstrates how the changes occurred across the different site types for the month:

Image June 2024 Data Report By Site Type

We track changes over multiple categories, we’ve included a few to demonstrate how these can be broken down:

Image June 2024 Network Report By Franchise Category