Identifying and analysing dealership trends needn’t be hard work. We now produce a bi-monthly market report that runs alongside our flagship products. Just skimming through changes for February, we’ve produced some results below.
You can also see our January 2023 Dealership report here.

Dealerships - Analysis By Vehicle Type
The February 2023 report shows 430 changes to the car dealership network alone. Following along in second, we have light commercial vehicles at 142. Motorcycles are third, with 123. Finally, heavy goods vehicles represent 13 changes for the month.
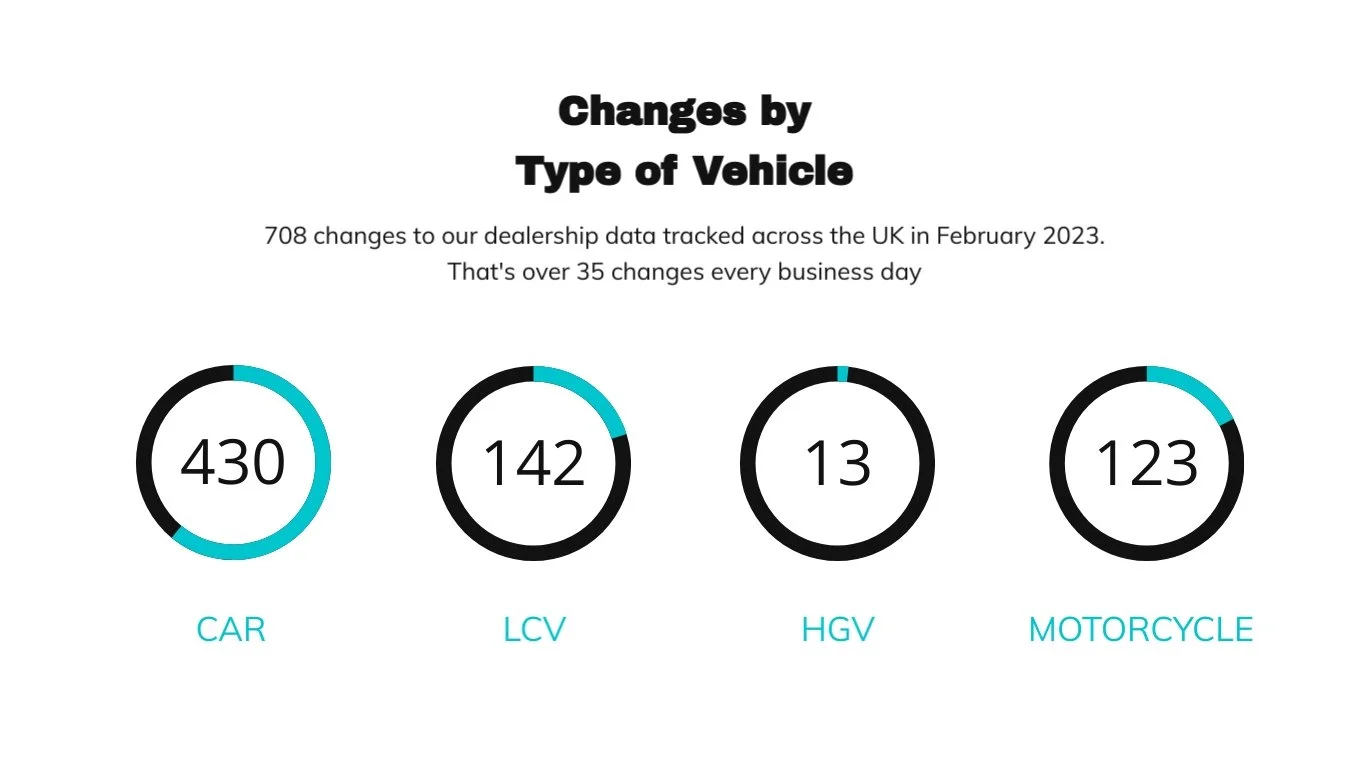
Image of changes by Car, LCV/HGV & Motorcycle - February 2023
Data Change By Site Type
Showing the spread of 708 changes by site type would be a nigh on impossible task without Autosites ability to rank and file. Here, we break the data down and show the splits in an easy to read pie chart.
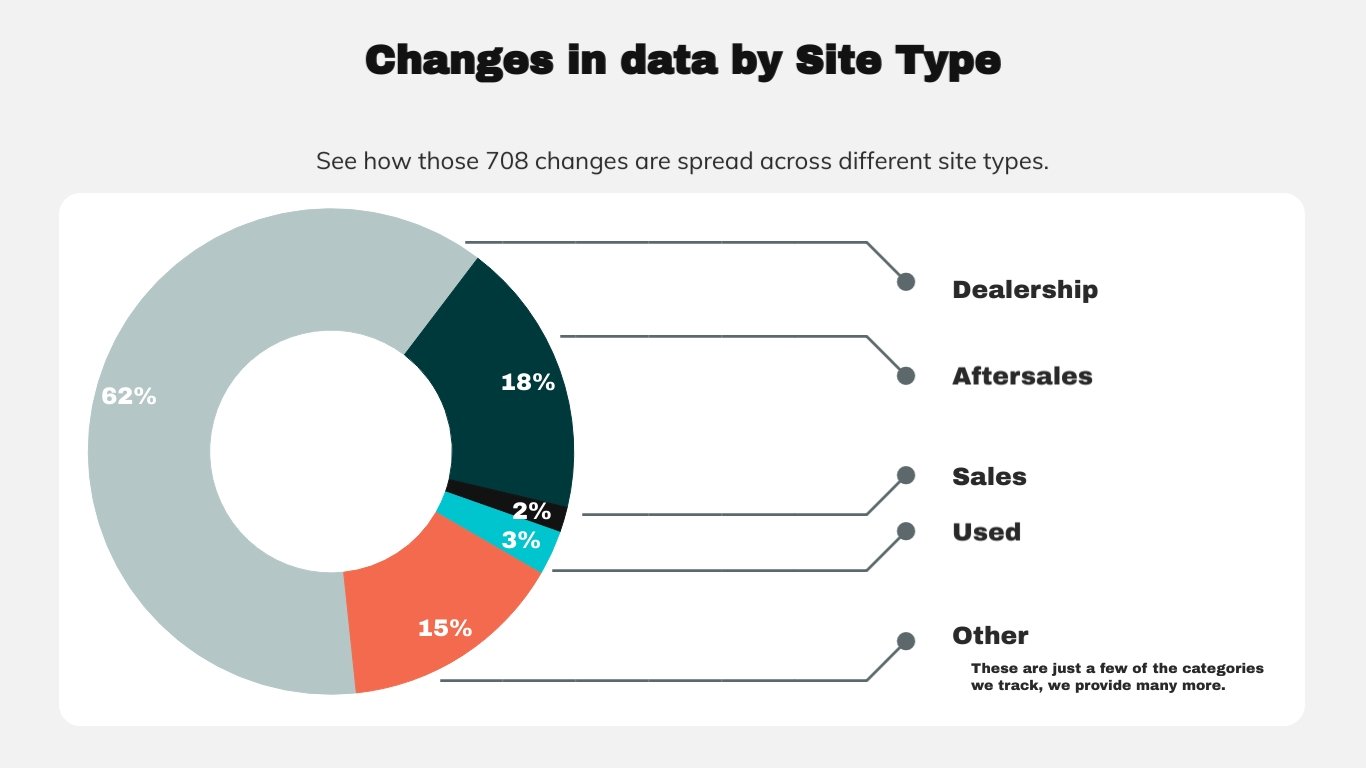
Image: Pie Chart of Changes in Data By Site Type February 2023
Site Activity - What’s The Change in Category By Acivity Type?
The graphic below demonstrates the reasons for change at dealership locations, across our selection of categories. We track more, these are just a handful.
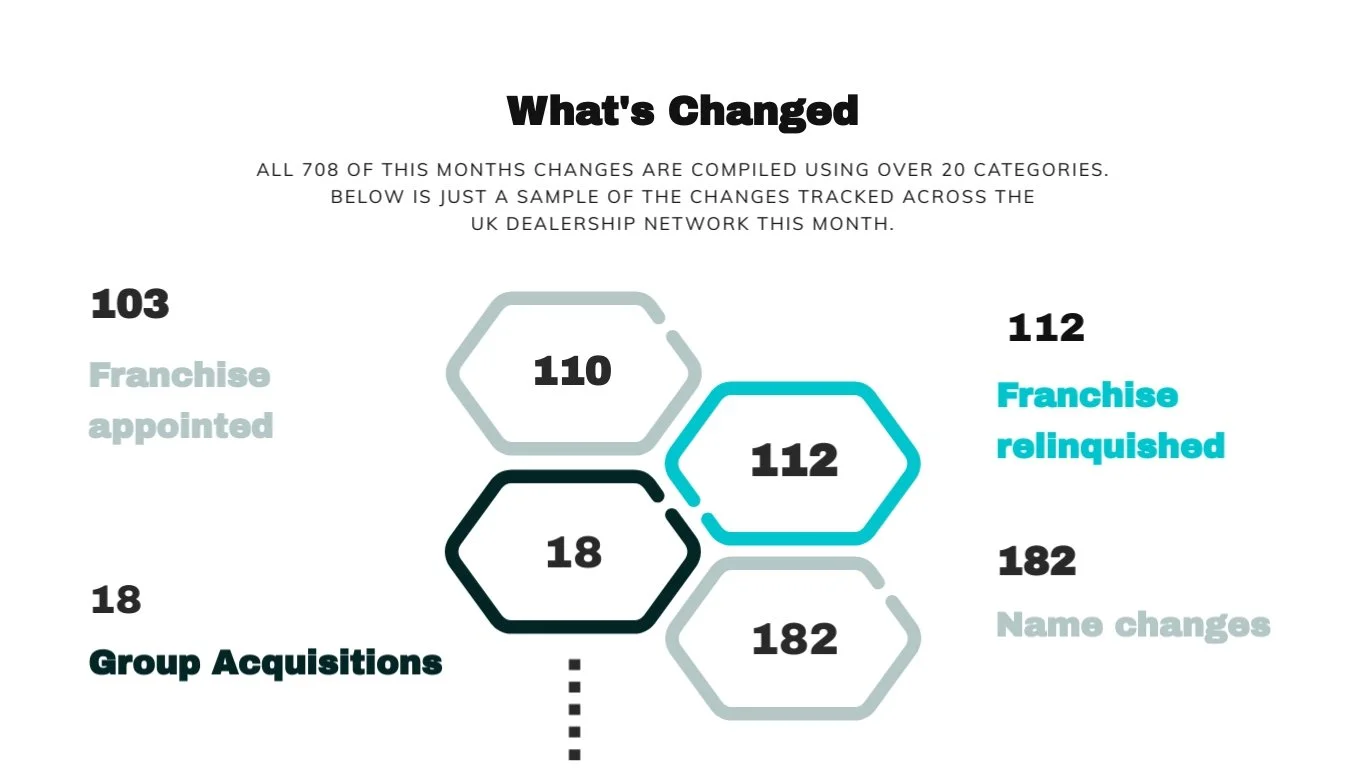
Image: Change in Category By Activity Type February 2023
Visualisation - What UK Regions Did Dealership Changes Take Place?
Autosites gives users the added advantage of showing regional changes by data type. Difficult to see here, but you can visually switch map pins on and off to suit your analysis purposes. The results can then be easily downloaded via csv file for import into other software.
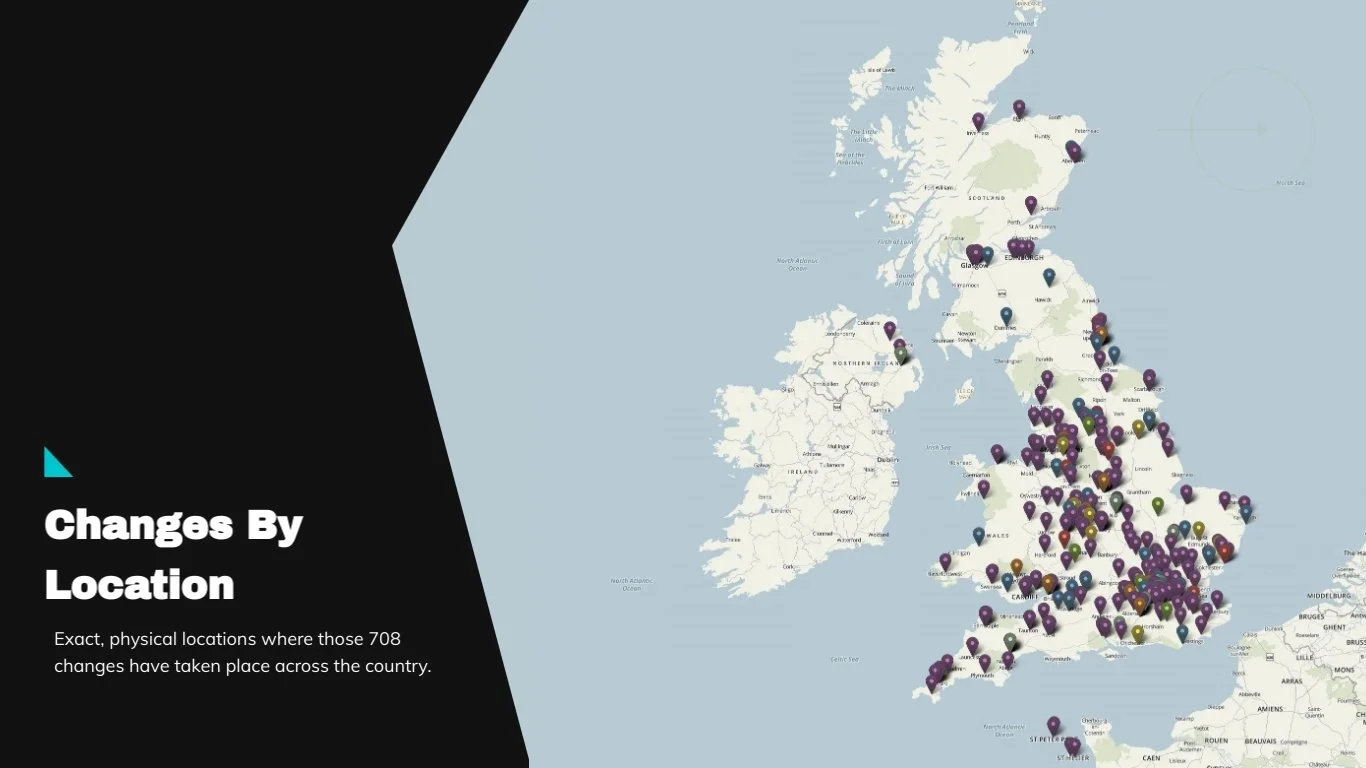
Image: Visualisation of UK Regional Dealership Changes February 2023