
Our May 2023 Dealership Analysis Report shows an uplift over April in terms of changes. In May, we managed to average some 16 changes daily. That’s a total of 330 for the month.
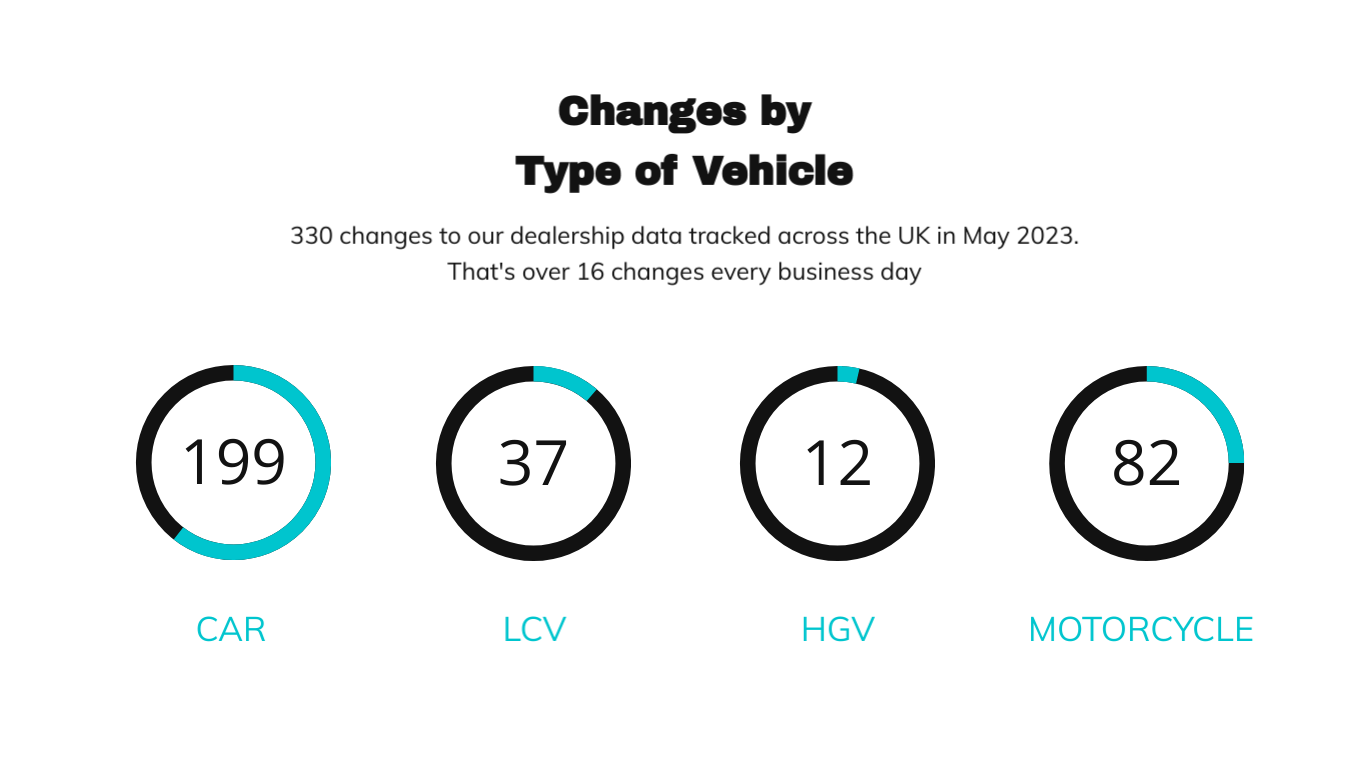
Car dealerships represent the biggest changes when it comes to changes by type of vehicle. Breaking the numbers down, there are 199 for Car, 37 for LCV, 12 for HGV and 82 for Motorcycles/ATV.

Here we’ve shown how the 330 changes by location have spread out accross the UK. There is less clustering in the capital than last month.

Coming onto changes in data by site type, we’ve seen the most movement in dealerships. However, aftersales sites show an increase over April’s figure of 18%. Changes in used car sales sites are up too (5% in April).
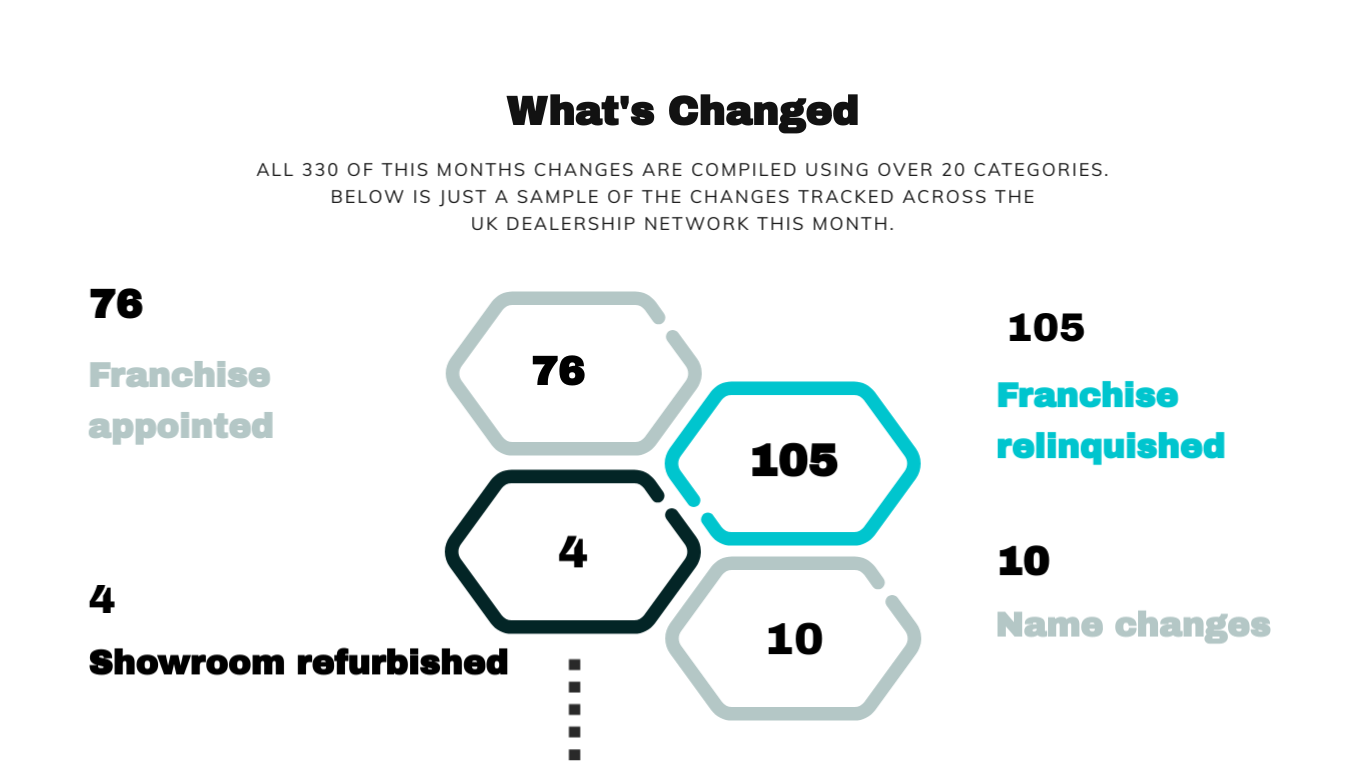
Franchises relinquished are up on April’s figures, as are franchise appointed (50 in April). In our bi monthly dealership analysis report we are able to drill down into the many categories we cover. Our full dataset allows for trend tracking across the dealer networks.