Viewing entries in
Data Update

Dealership Network Update December 2023

December Dealership Network Update Header 2023

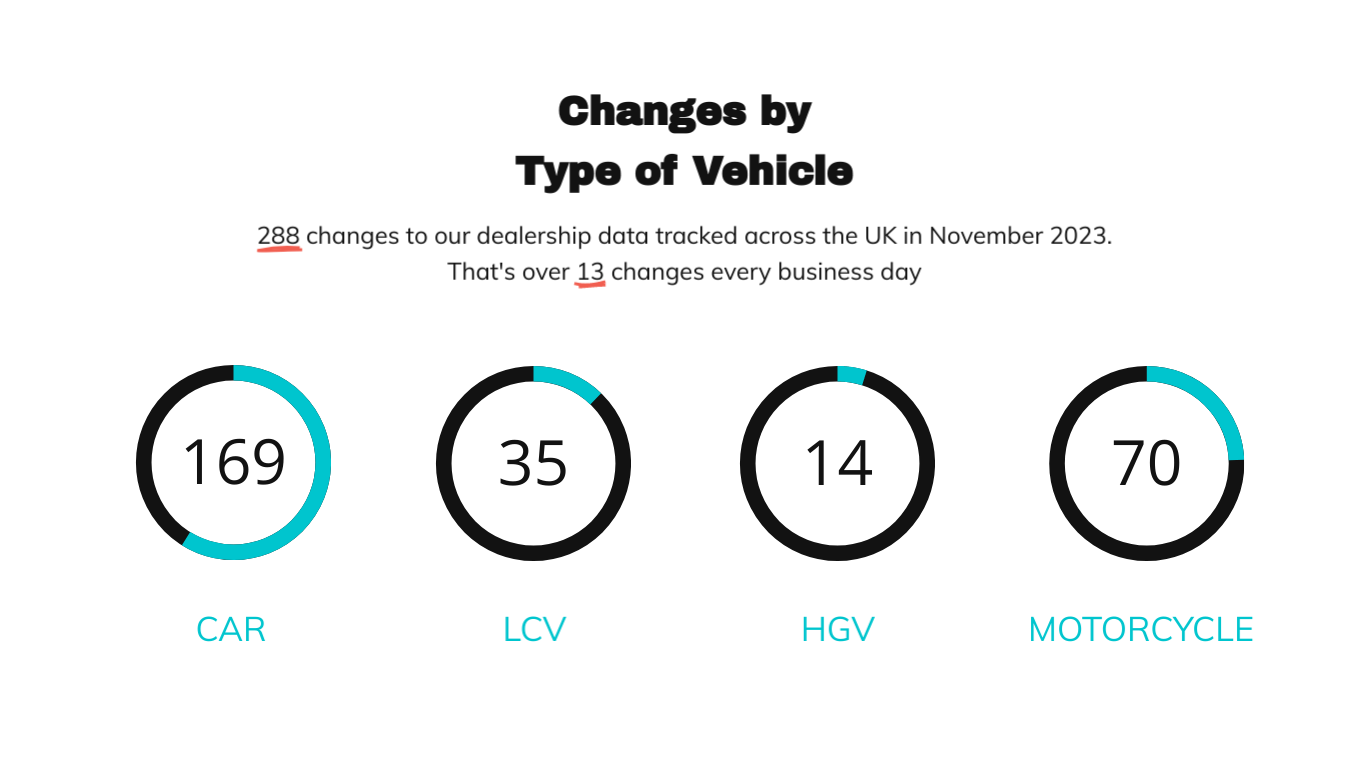
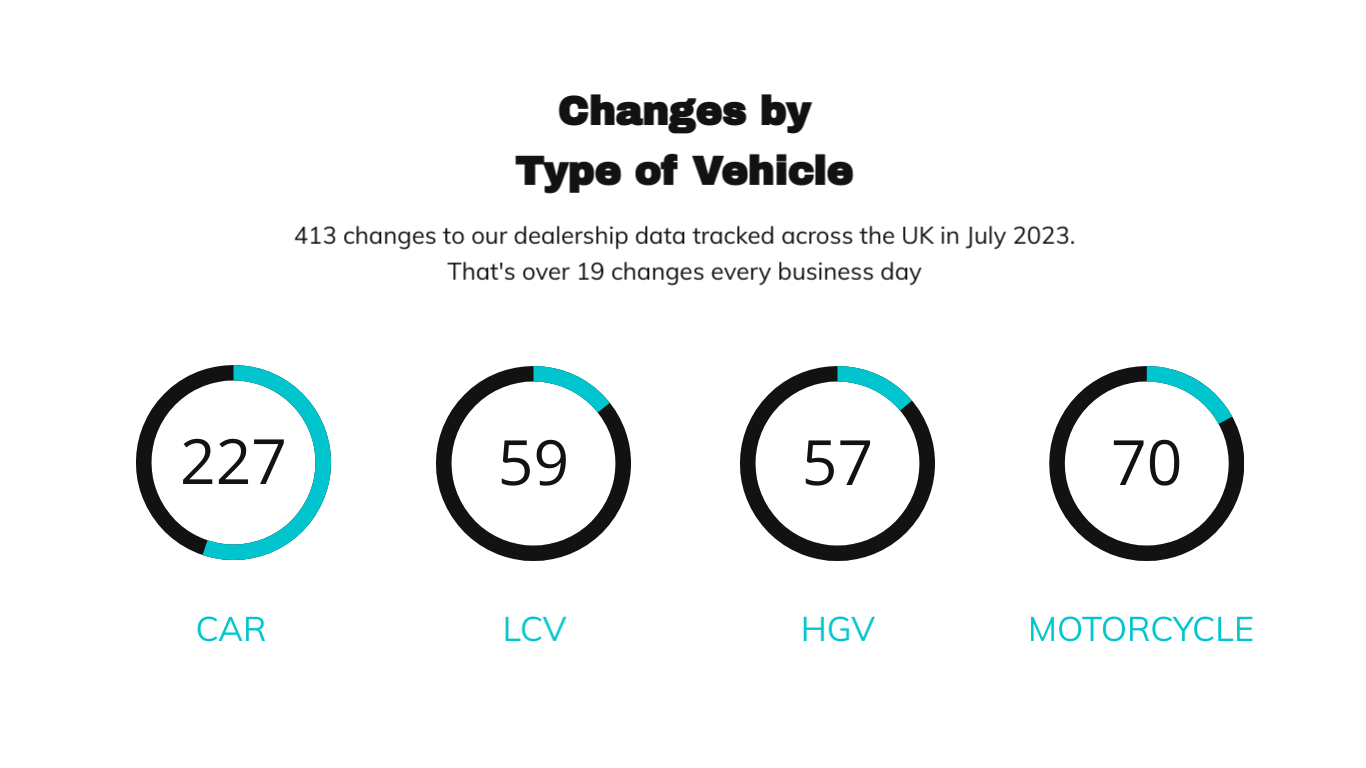
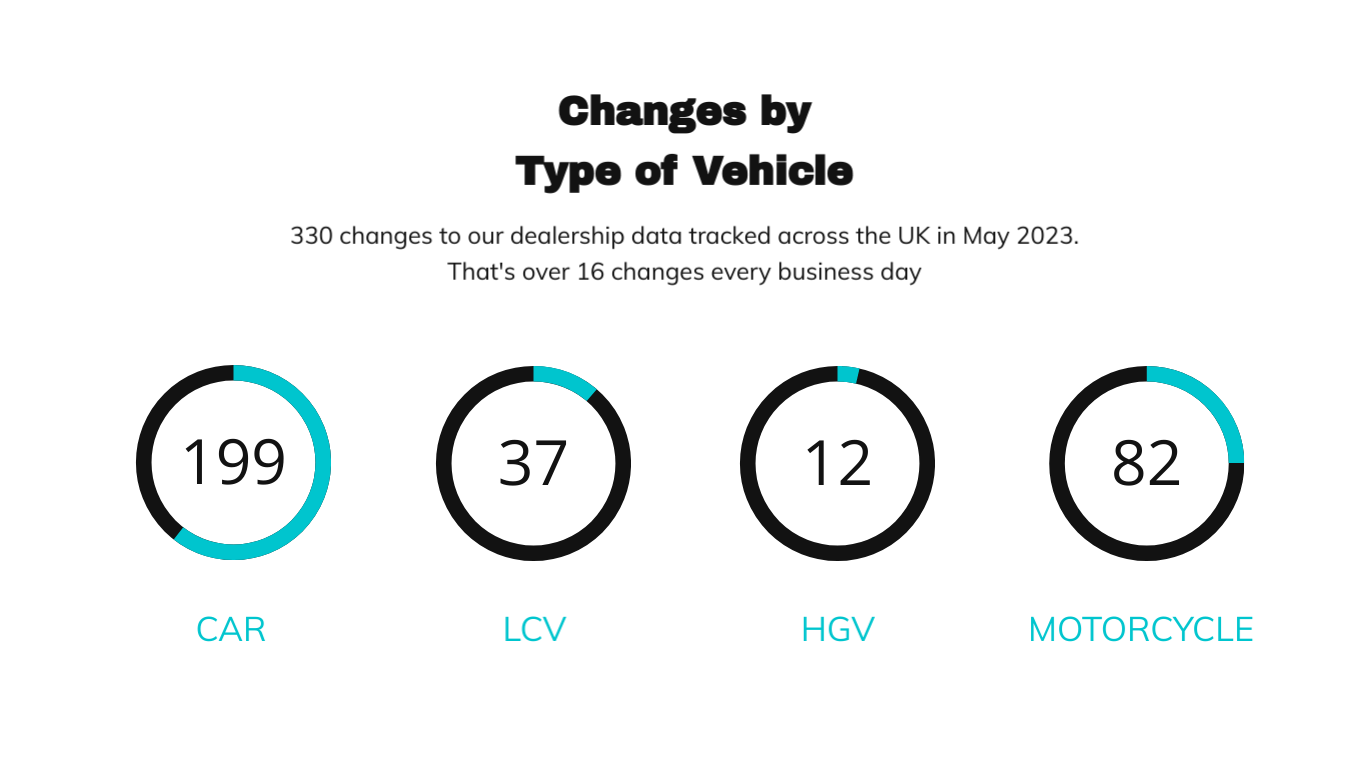
The December Dealership network update brings a fairly quiet close to the year. We recorded 227 changes for this month vs November’s figure of 288. Thats 12 changes per business day.

November 2023 Updates to Dealership by Type of Vehicle

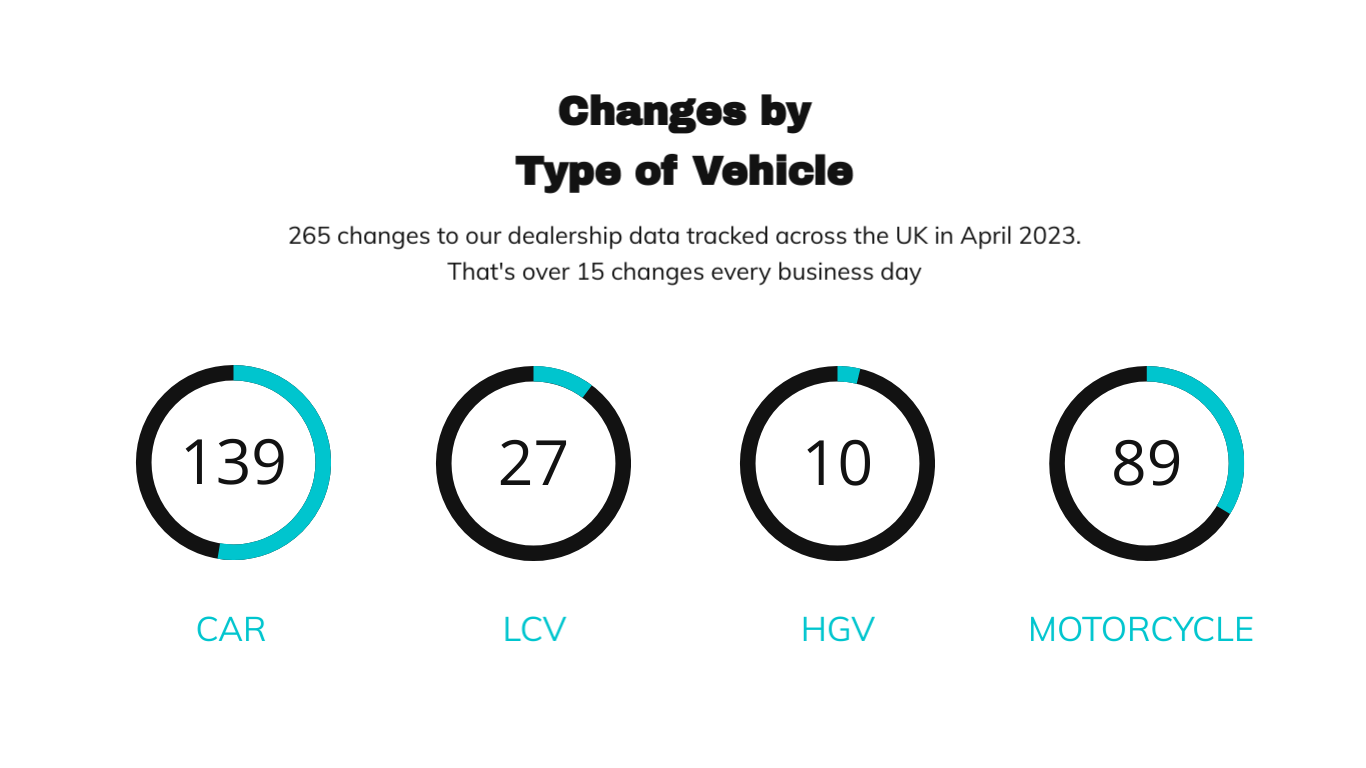
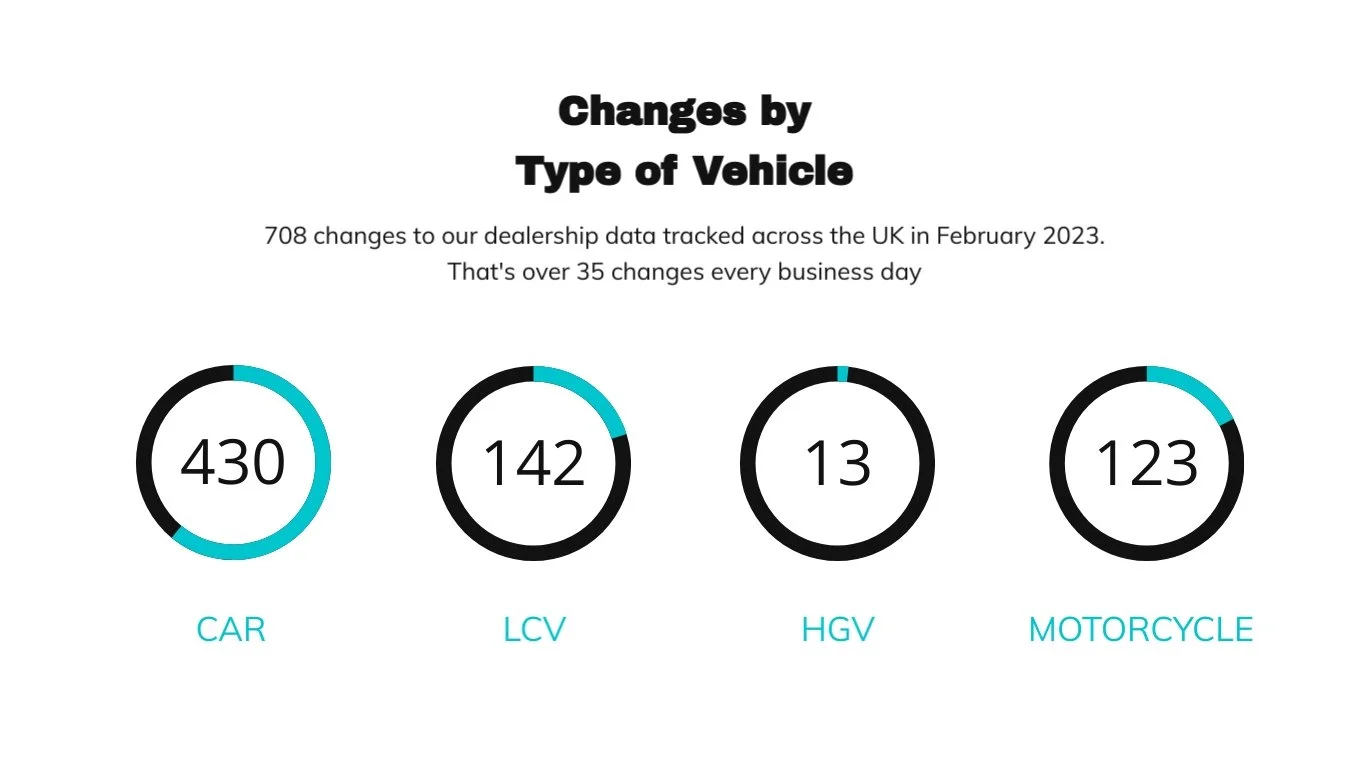
The updates to Dealership by type of vehicle have declined since November, with the exception of the LCV category, which has shown an increase of 22 changes. Novembers figures are shown in brackets: Car 139 (169), HGV 3, (14) and Motorcycle/ATV 28 (70).

December 2023 Updates By Dealership Location

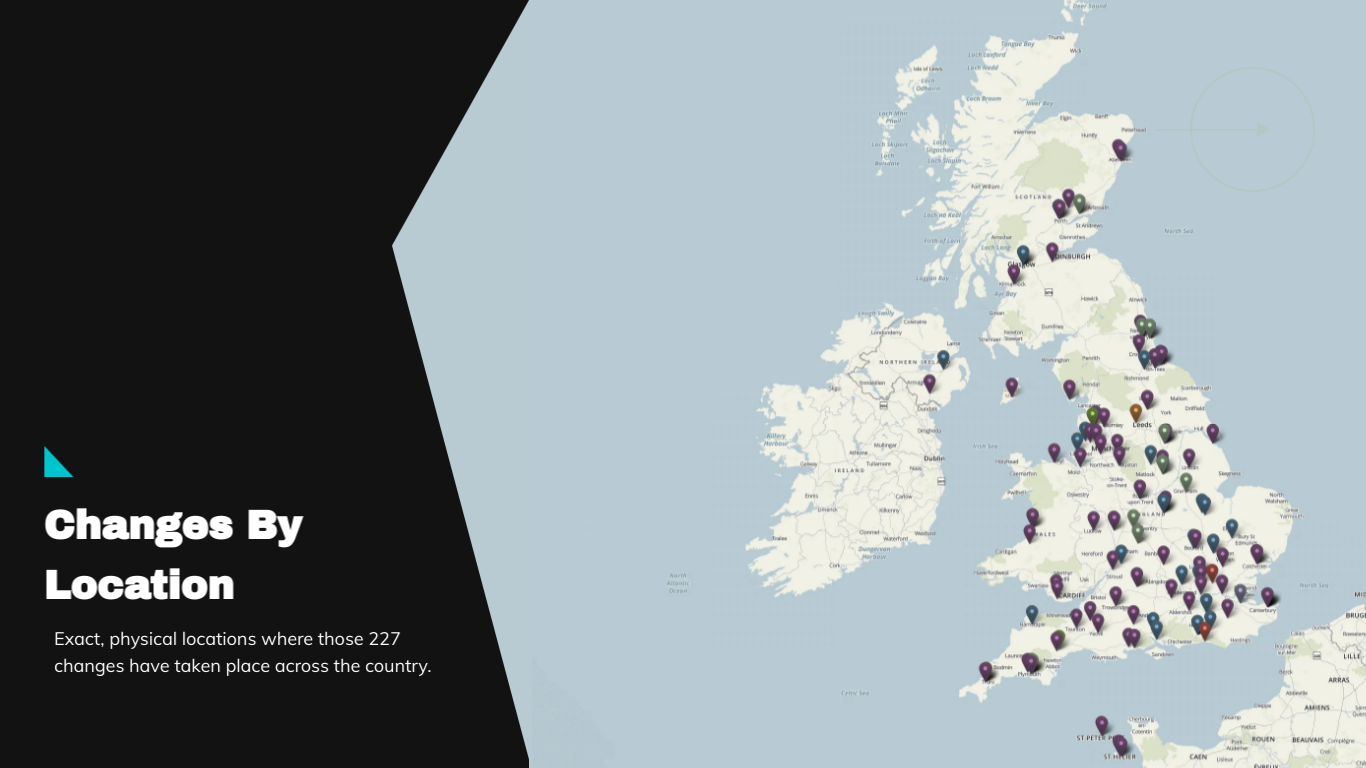
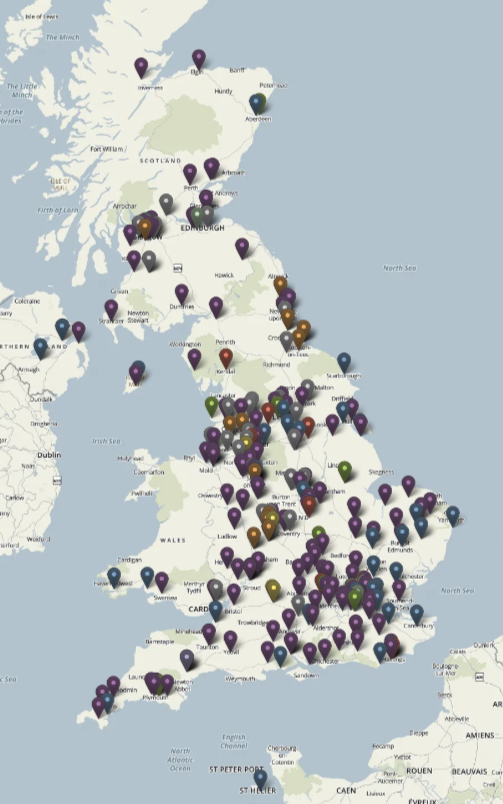
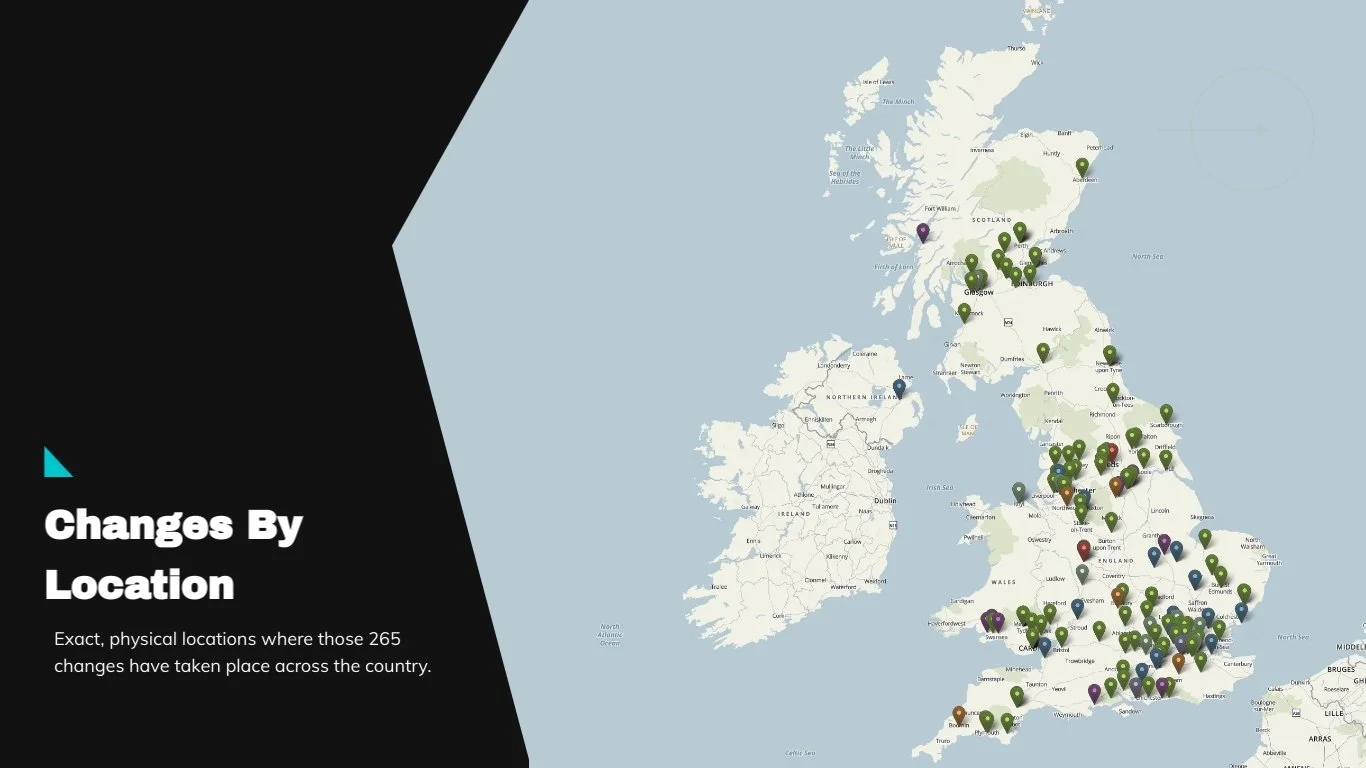
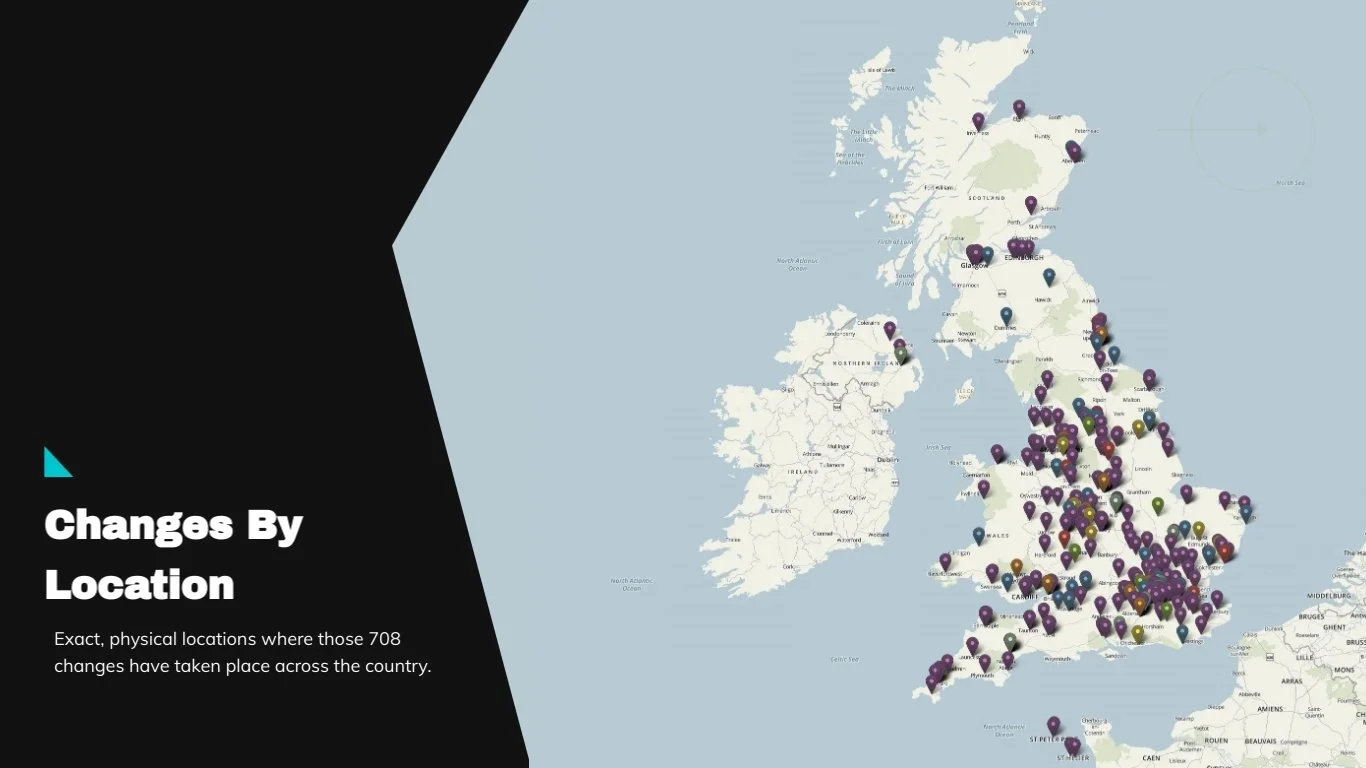
Dealership location changes for December are illustrated on the UK Map in the graphic above.

December 2023 Data Update By Site Type

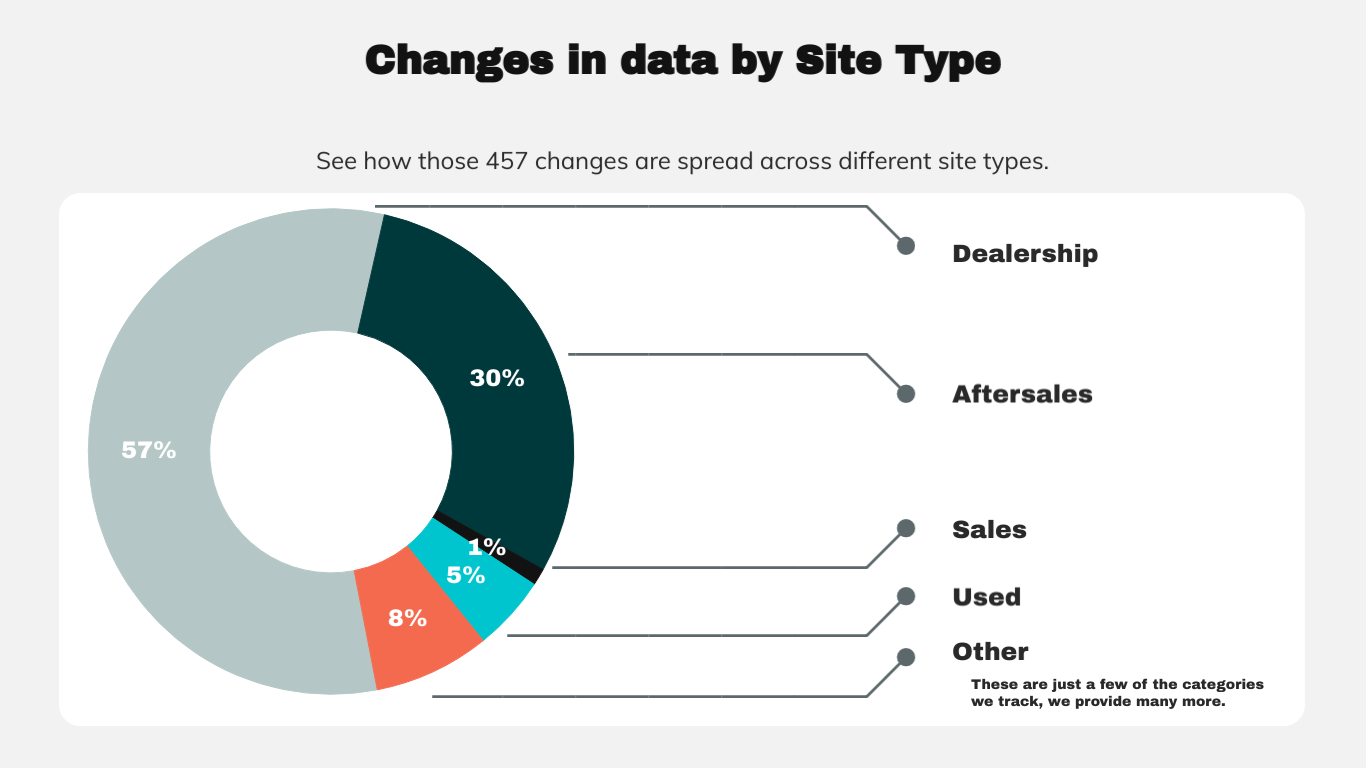
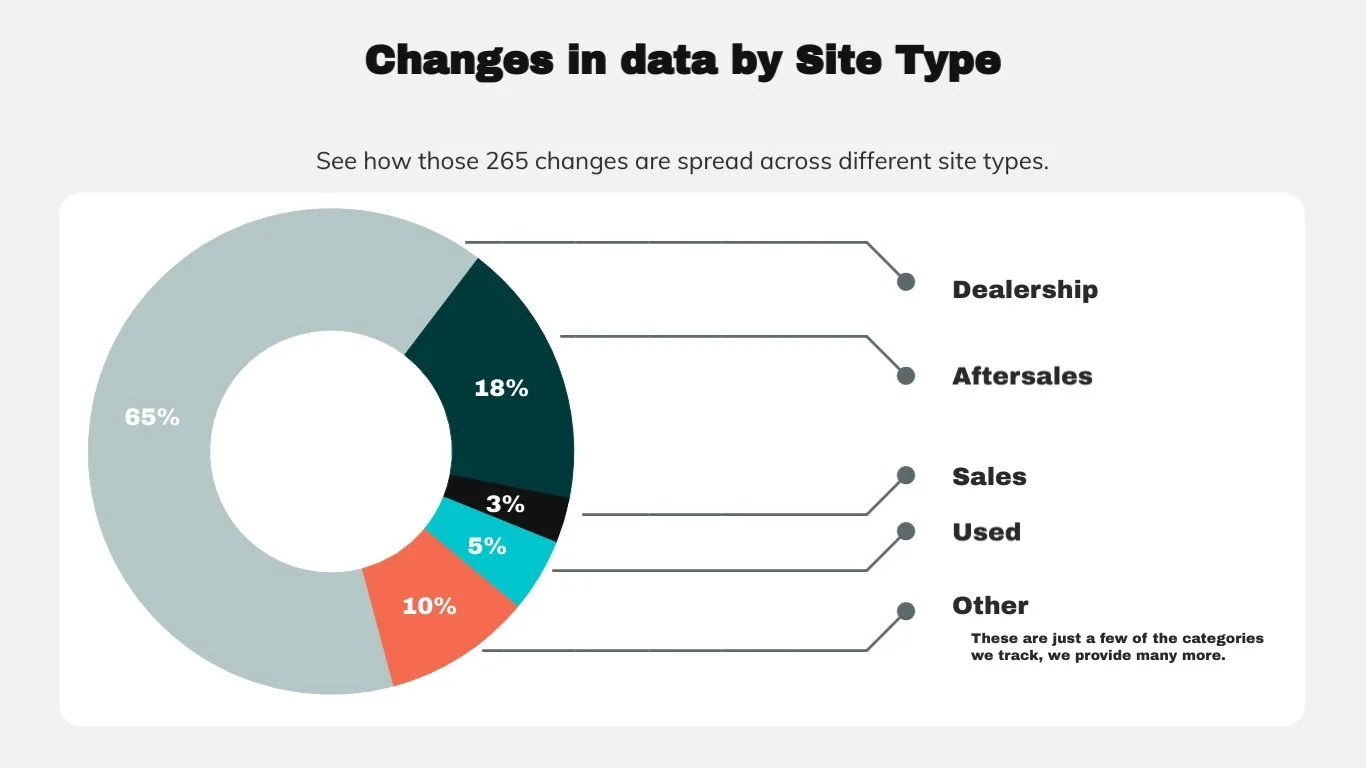
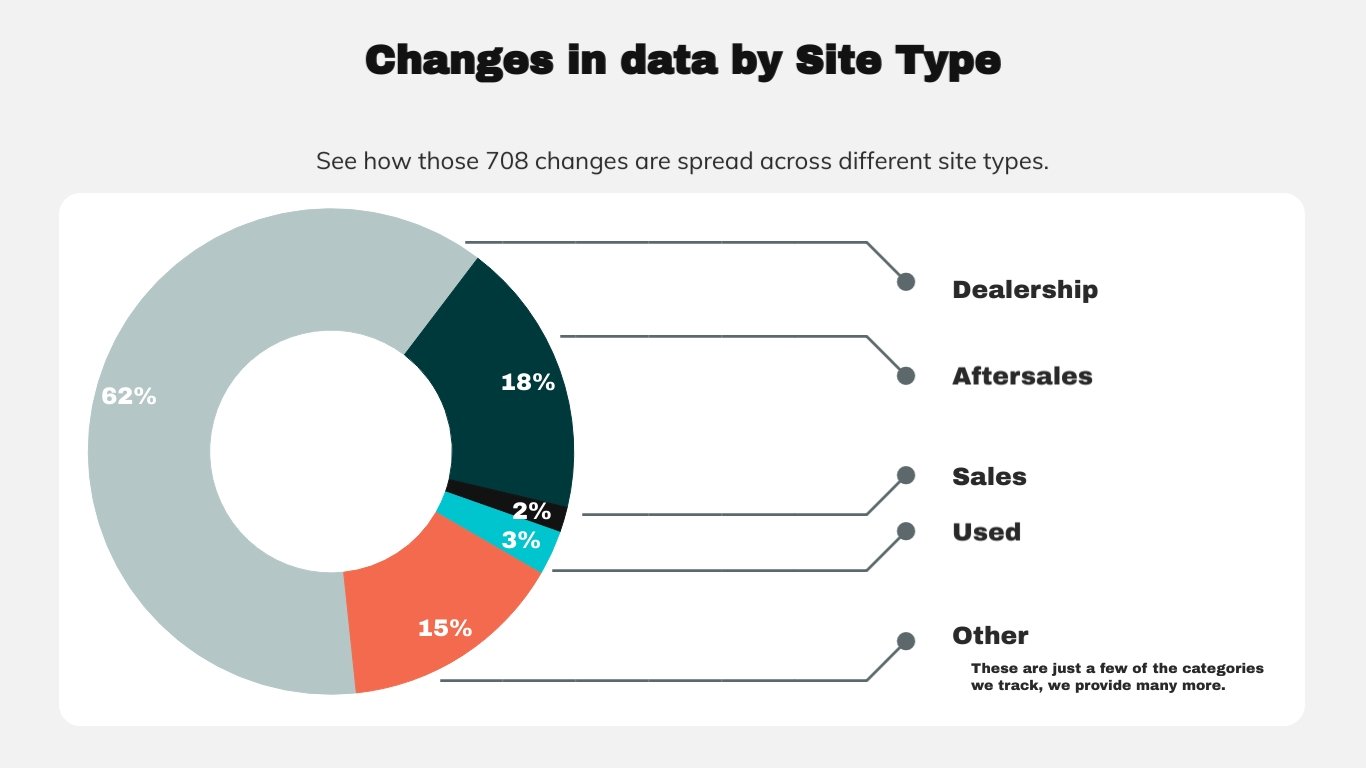
December 2023’s data update by site type is as usual, dominated by Dealerships. 52% in fact. Marginally down from from the November figure of 55%. This month aftersales sites show a significant increase over the previous month, 30% (from 18%). The used figure of 9% is similar to previous one at 7%. The ‘others’ category has shrunk from 19% to just 7% this month.

December Network Update By Franchise Category

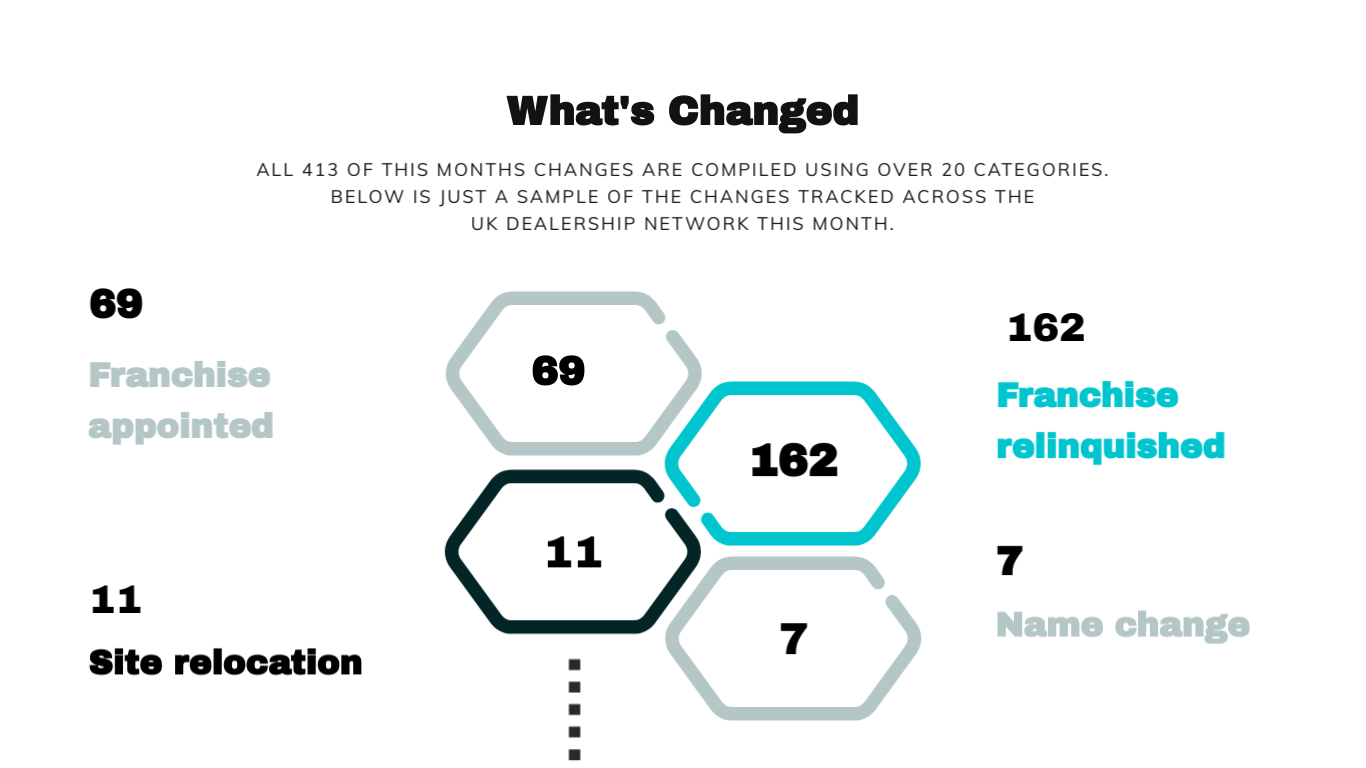
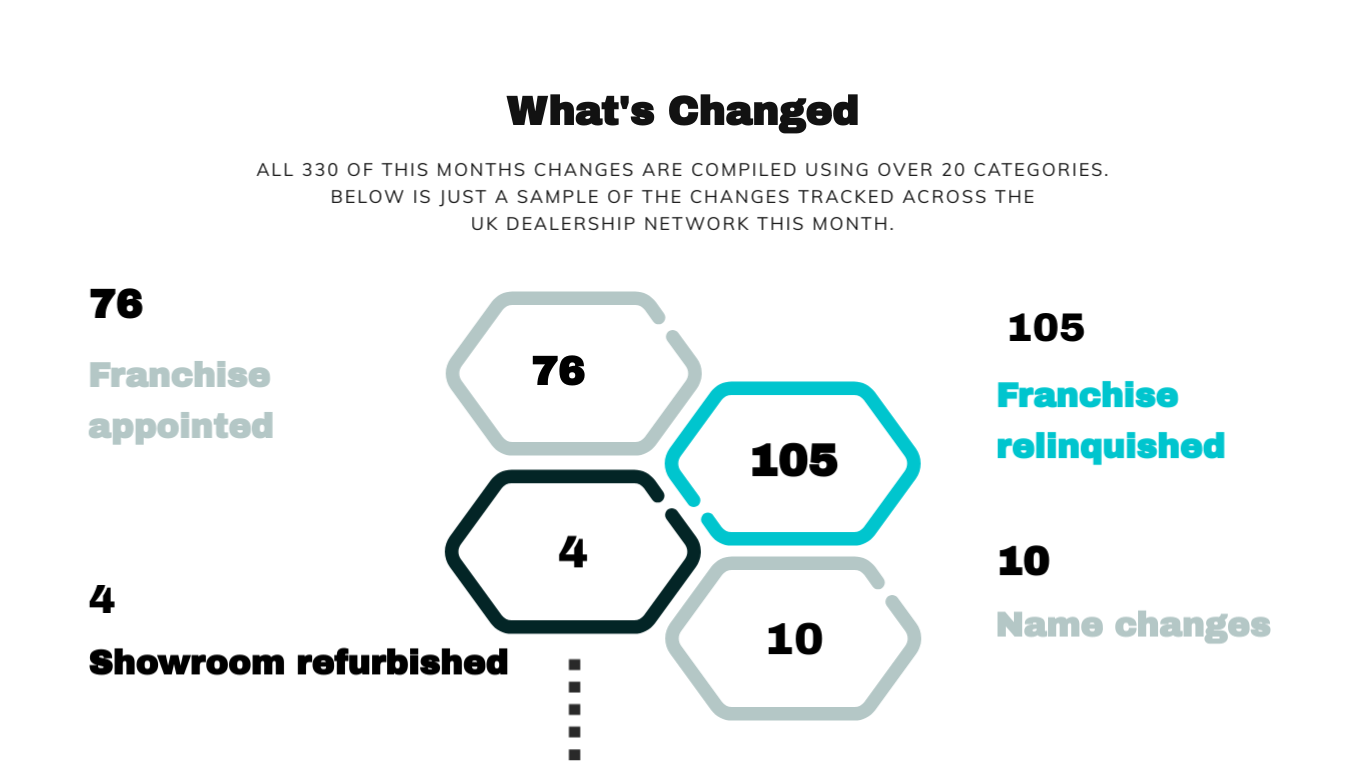
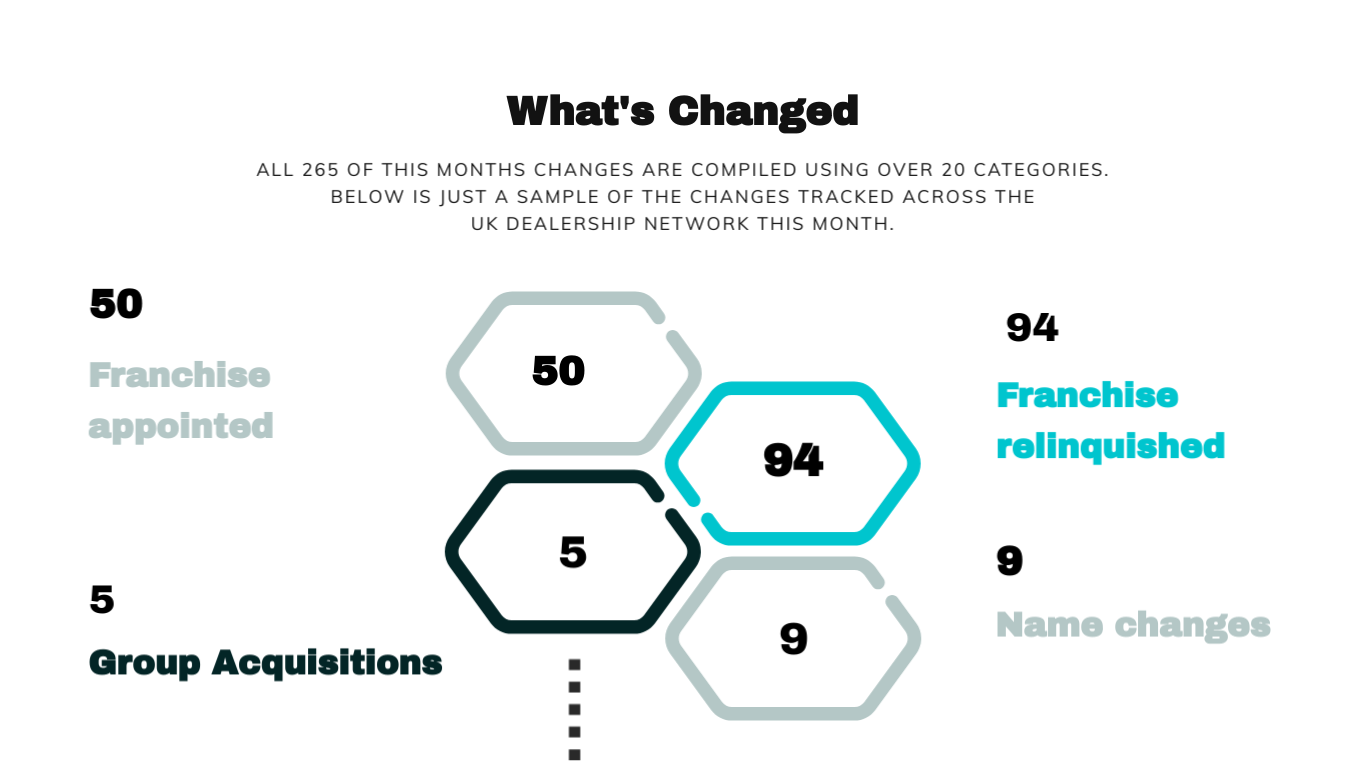
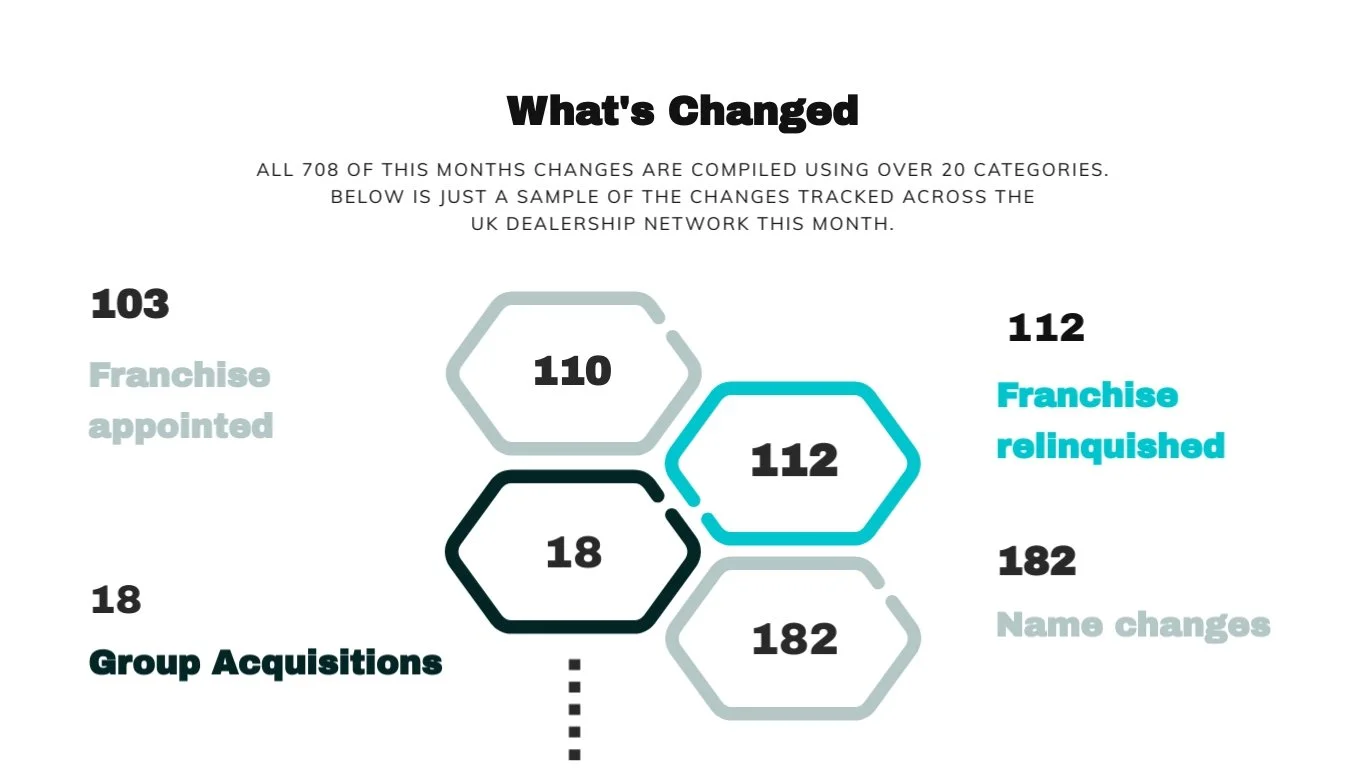
Finising off with the update with changes by franchise category, we’ve totalled 69 changes by franchise appointed (vs 67 in November), 52 franchises relinquished (vs 49) and 7 site relocations (vs 17 in the previous month).

Contact JS Management

Dealership Network Update November 2023

November Dealership Network Update Header 2023

A quiet November across the vehicle Dealership networks. This months movements produced 288 changes, giving us a reduction of 105 vs October.

November 2023 Updates to Dealership by Type of Vehicle

Updates to dealerships by type of vehicle are represented in the graphic above. We recorded 169 (213) for car, 35 LCV (64), 14 HGV (24) and 70 motorcycle and ATV (92). Octobers figures are shown in brackets.

November 2023 Updates By Dealership Location

November 2023’s updates by Dealership location are represented in the UK map above. In this image, it is easy to see exacly where in the country the changes occured. Existing clients clients can easily toggle different categories of Dealerships on and off, as well as identifying trends and specifics via date ranges.

November 2023 Data Update By Site Type

This months (again, we’re showing October in brackets) data update by site type identifies Dealerships as the biggest movers at 55% (54%), aftersales 18% (19%), Sales 1% (3%) and used 7% (10%). Changes in ‘other’ categories 19% vs 14% in October.

November Network Update By Franchise Category

When it comes to breaking data down by a multitude of different categories, we’re certainly not shy. This sample demonstrates a few of the datasets available. 67 franchises appointed (vs October at 74), 49 franchises relinquished (vs October at 37).

For a small annual subscription, we also produce a bi monthy dealership report. This is particularly useful for those who wish to use frequent change data for prospecting car dealerships, you can see more on the detail of that report here.

Dealership Analysis Report October 2023

October-2023 Dealership Network-Update

The October Dealership Analysis Report shows an increase in activity over September. We’re up closer to 400 changes, giving us an increase of precisely 41.

October 2023 Changes to Dealership by Vehicle Type

Breaking the month down for changes by type of vehicle, we’ve totted up 213 on passenger car, 64 on light commercials, 24 on heavy goods vehicles, and finally 92 on motorcycle and ATV. This gives us more than 18 every business day.

October 2023 Change By Dealership Location Type

This months fluctuations in the Dealership network can be conveniently represented across the UK, as we demonstrate here in our map. Clients can easily toggle between different data sets in our Autosites platform. It’s as easy as checking a box (really!). If you are an SMMT data subscriber, you could overlay this with registration data.

October 2023 Data Change By Site Type

Breaking the data down by site type, we can see that Dealerships report the largest change category change at 54%, aftesales sites come in second with 19%, used sites at 10% and sales (new) at just 3%. Others, (which is a mixed bag of additional categories we track) come in at 14%.

October Change By Franchise Category

October’s monthly numbers by franchise category demonstrate our ability to provide insight, by tracking a plethora of different categories. In the mix for this month we’ve uncovered 74 franchises appointed (vs Septembers 58), 37 franchises relinquished (vs Septembers 82).

We also produce a bi monthly report of data changes by the different categories. Very reasonably priced, and delivered straight to the users inbox. Ideal for those who want to use our data for prospecting dealerships, based on their change profile. As well as a detailed .csv file, there is a pdf report explaining the contextual relationship across the various brands.

See you in November.

Dealership Analysis Report September 2023

Header Image September 2023 Dealership Analysis Report

Less activity for September 2023’s Dealership Analysis Report, giving us some 352 changes accross the networks. We can report a slight uplift in the numbers for HGV and Motorcycle though.

Image September 2023 Changes By Vehicle Type

For September 2023, changes by vehicle type are represented thus: Car - 199, LCV - 51, HGV - 17, Motorcycle - 85. This equates to 16 changes per working day for the period.

Image UK Dealership Changes By Location September 2023

Map - UK Dealership Changes By Location September 2023

Not wishing to leave our clients without the full picture, we’ve plotted September’s changes on a UK map. For users of the full product, drive data is available. This makes it easy to visualise distance between any multiple of different queries.

Image September 2023 Changes By Site Type

Although the overall numbers are down, this months changes by site type show similar percentages to August, across all sites.

Image September 2023 Change By Franchise Category

September’s month changes by category, provide an insight into another available data set. Since there are over 20 of these categories, we’ve just picked out a few to keep things concise. September gives us 56 vehicle franchises appointed (vs 79 in August) and 82 relinquished (vs 108 in August).

Our bi monthly dealership update report is useful for those who are interested in a detailed representation of ‘what’s changed’. A trend tracker if you will. More details are available: https://www.jsmanagement.com/franchised-dealership-update-report

Until next month…

Dealership Analysis Report August 2023

Header Image August 2023 Dealership Analysis Report

August 2023’s UK dealership analysis, brings some 470 changes into focus. Autosites brings you a snapshot of essential data, for those planning for the imminent changes faced within our industry.

Image August 2023-Changes By Vehicle Type

August’s changes by vehicle type are broken down as follows: Car - 280, LCV - 86, HGV - 11 and Motorcyle and ATV 93. These figures amount to 21 changes every business day.

Map - UK Dealership Changes By Location August 2023

What good would it be if you couldn’t see where the movements took place? Our map displays an image of the precise location the changes took place. Our subscribers can easily zoom in and see the drive distance between dealerships.

Image August 2023 Changes By Site Type

Digging into changes by site type, we can see car dealerships dominating the landscape. For August 2023, we’re up from 48 to 52% on dealerships alone. The picture for aftersales is different with August’s figures down on July (45 vs 23%).

Image August Change By Franchise Category

Looking at the changes by category for August, we’ve seen 79 vehicle franchises appointed (vs 69 in July), and 108 relinquished (vs 162 in July). We track a variety of other cataegories in the dataset also.

For businesses that want to see detailed information on a bi monthly basis, our dealership analysis report fits the bill.

For a more in depth picture our dealership database, which powers Autosites - we can report on daily changes across the entire UK vehicle networks.

Dealership Analysis Report July 2023

The Dealership Analysis report for July 2023 brings another 413 changes for the month. Representing 19 changes per day, covering vehicle types : Car, LCV, HGV , Motorcycles and ATV. The image below provides a graphic representation.

July 2023 Changes By Vehicle Type

A quieter month this one, totalling 284 changes across the Car dealership landscape. For LCV’s, the figure is similar to June, albeit a slight uplift. The spike in HGV’s is a one off & due to a reprofiling of a single manufacturers site categories.

July 2023 Changes By Site Type

For July’s changes by site type, unusually we have aftersales beating out dealership figures. These are 10% up over June’s figures. July’s Dealership changes are down 17% over those in June.

July Change By Franchise Category

Working through July’s Change By Franchise Category, we can report 69 franchised appointments (vs 48 in June) and 162 relinquished (219 in June). There are numerous other categories we track, far too many to mention here.

Some businesss may wish to see analysis on just the sites that have changed over a given period. For this, we have a standard dealershp analysis report, which is produced bi monthly. For a fuller and more detailed picture, our dealership database access has the functionality to report on all brands across the UK’s Car, LCV, HGV, Motorcycles and ATV networks..

Dealership Analysis Report June 2023

In our car dealership analysis report for June 2023, we’ve recorded 450+ changes across the UK franchised network, racking up over 20 on a daily basis. The image below, shows those changes by type of vehicle.

Changes by vehicle type June 2023

Car Dealerships usualy command the most attention, and this month is no exception. There are 284 for car, 63 for LCV, 14 for HGV & 96 for Motorcycles and ATV.

Image of Dealership Location Changes on UK Map

In the image above we demonstrate where those 457 Dealership location changes have occured in the UK.

Image: June 2023 Changes By Site Type

June 2023 - data changes by site type. Again, Dealerships registering the most movement, this figure is slightly down on May. Aftersales sites however, have shown an increase over the previous month (30% from 22%). Used car site data shows a decrease this month from 5% from 12% over May 2023.

Image June Change By Franchise Category

Looking at Junes figures by franchise category, franchises relinquished have doubled over the previous month. Along with franchises appointed 76 (in May) vs just 48 this month.

For those who wish to drill down further, we produce a dealership analysis report on a bi monthly basis. This provides a more detailed view of the changes by category. For subsribers of our full dataset, we have data available to track trends across the entire UK dealership networks. We cover all brands - Car, LCV, HGV, Motorcycles and ATV.

Dealership Analysis Report May 2023

Our May 2023 Dealership Analysis Report shows an uplift over April in terms of changes. In May, we managed to average some 16 changes daily. That’s a total of 330 for the month.

Car dealerships represent the biggest changes when it comes to changes by type of vehicle. Breaking the numbers down, there are 199 for Car, 37 for LCV, 12 for HGV and 82 for Motorcycles/ATV.

Here we’ve shown how the 330 changes by location have spread out accross the UK. There is less clustering in the capital than last month.

Coming onto changes in data by site type, we’ve seen the most movement in dealerships. However, aftersales sites show an increase over April’s figure of 18%. Changes in used car sales sites are up too (5% in April).

Franchises relinquished are up on April’s figures, as are franchise appointed (50 in April). In our bi monthly dealership analysis report we are able to drill down into the many categories we cover. Our full dataset allows for trend tracking across the dealer networks.

Dealership Analysis Report - April 2023

The UK Dealership Analysis Report for April 2023 presents data across a number of dealership categories. For April, we’ve recorded 265 changes in total.

Breaking the report down across the changes, we have 139 for Car, 27 for LCV, 10 for HGV and 89 for Motorcycles/ATV’s

Aprils changes in location illustrate a reasonable spread accross the country. As usual there are clusters around the capital.

Spreading the changes in data by their site type, the numbers are weighted towards dealerships, the remainder aftersales sites, plus a mixture of used cars and others.

Focusing on the main categories, the UK Dealership Analysis Report for April 2023 highlights a signifiant difference between those relinquishing their franchises and the appointment of new.

For those who need a more detailed dealership trend tracker, we produce a bi monthy subscription here.

Dealership Analysis Report - March 2023

For March 2023 , we’ve racked up some 482 chages via our Dealership Analysis Reporting activities. This represents a decrease on the figures for our February Report.

Not content with beaavering away tracking data, we also visited the 2023 Commercial Vehicle Show at the NEC. Well, someone had to give us an excuse to get out!

Image March 2023 Dealership Analysis Report Header

Analysis of Dealership by Vehicle Type

Breaking down the changes by vehicle type, the 482 break down thus: Car - 224, LCV 95, HGV 32, with Motorcycle and ATV at 131.

Image of Analysis of Dealerships By Vehicle Type March 2023

Image: Analysis of Dealerships By Vehicle Type March 2023

Reporting on Changes in Data by Site Type

Making sense of data shouldn’t be all time consuming. In this image we demonstrate clearly how thos 482 changes pan out by site type.

Reporting on Changes in Data by Site Type

Image: Reporting on Changes in Data by Site Type

A Change In Category By Acivity Type? No Problem

There are many reasons for category changes. In the graphic below, we’ve highlighted a few from the many that we monitor.

Image: Change In Category By Acivity Type

Image: Change In Category By Acivity Type

A Visualisation of UK Changes By Location

How do the changes stack up across the country? The next image shows changes a visualisation of UK Dealerships by location.

Image: Visualisation of UK Changes by Location March 2023

Image: Visualisation of UK Changes by Location March 2023


We also recently launched a new data change report for dealerships. You could get a subscription here.

Dealership Analysis - A Market Report For February 2023

Identifying and analysing dealership trends needn’t be hard work. We now produce a bi-monthly market report that runs alongside our flagship products. Just skimming through changes for February, we’ve produced some results below.

You can also see our January 2023 Dealership report here.

Image: February 2023 Dealership Market Report Header

Dealerships - Analysis By Vehicle Type

The February 2023 report shows 430 changes to the car dealership network alone. Following along in second, we have light commercial vehicles at 142. Motorcycles are third, with 123. Finally, heavy goods vehicles represent 13 changes for the month.

Dealerships Analysis By Vehicle Type

Image of changes by Car, LCV/HGV & Motorcycle - February 2023

Data Change By Site Type

Showing the spread of 708 changes by site type would be a nigh on impossible task without Autosites ability to rank and file. Here, we break the data down and show the splits in an easy to read pie chart.

Image: Data Change By Site Type

Image: Pie Chart of Changes in Data By Site Type February 2023

Site Activity - What’s The Change in Category By Acivity Type?

The graphic below demonstrates the reasons for change at dealership locations, across our selection of categories. We track more, these are just a handful.

Image: Change at Dealership Location By Activity Type

Image: Change in Category By Activity Type February 2023

Visualisation - What UK Regions Did Dealership Changes Take Place?

Autosites gives users the added advantage of showing regional changes by data type. Difficult to see here, but you can visually switch map pins on and off to suit your analysis purposes. The results can then be easily downloaded via csv file for import into other software.

Image: Visualisation UK Regional Dealership Changes February 2023

Image: Visualisation of UK Regional Dealership Changes February 2023


Dealership Analysis Report - January 2023

A new year and a busier month than December 2022’s Dealership trend report our system has tracked 500+ data changes across the UK Dealer networks.

Dealership Analysis Report January 2023 Header Intro

Analysis of Dealerships by Vehicle Type

This months analysis shows the breakdown of changes by vehicle type. Passenger cars are demonstrating the most changes, with Motorcycle & ATV’s coming in second.

Analysis of Dealerships by Vehicle Type January 2023

Image: Analysis of Dealerships by Vehicle Type January 2023

Data Analysis - Change By Type of Site

Another area we are able to report on is the change in dealership data by site type. This gives users a choice of different metrics to analyse over a given period.

Data Analysis Change By Type of Site January 2023

Image: Data Analysis Change By Type of Site January 2023

Dealership Classification By Site Activity

What caused the change in data in January 2023? Here we show just a handful of categories tracked, classification by site activity can help the analyst to build a picture of an area of interest.

Dealership Classification By Site Activity January 2023

Image: Dealership Classification By Site Activity January 2023

Data Visualisation - A geographical representation of where change took place

Demonstrating the importance of using data as a visualisation, the image represents the exact locations of where the changes took place.

Geographical-Representation of Changes January 2023

Image: Change By Location January 2023


Web Analytics